
ProShares Is Doing "The Splits": What This Means For Volatility Investing Strategies
With each passing week, month and year, Volatility ETPs have become more and more popular. This was no more greatly evidenced than with last week’s volume indicator for certain of these ETPs, especially those offering double-leverage. But I’ll get back to this point in a moment as there are more pressing matters to discuss.
It’s coming, again. Last week ProShares announced yet another forward and reverse split for several of its ETFs.
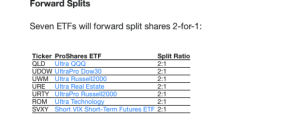
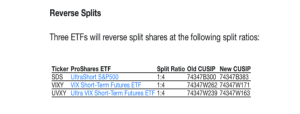
As it pertains to the maintenance of these instruments, the funds will trade at their post-split prices on July 17, 2017. The ticker symbols and CUSIP numbers for the funds will not change. I tend only to concern myself and Golden Capital Portfolio fund with ProShares Ultra VIX Short-Term Futures ETF (UVXY), as this will mark the ETFs 8th reverse split since it came to the market in 2011. This will also be the second reverse split for UVXY in 2017. As a volatility short participant with Golden Capital Portfolio, I’ve remained short shares of UVXY since 2012, adding and eliminating shares within the fund once they achieve a 99.99% return on invested capital (ROIC).
With a reverse split approaching I often offer caution for those participating with UVXY and like VIX-leveraged ETPs from the long side. In an article I authored earlier this year titled UVXY: Pre-Split Caution Being Raised, I offer the following warnings for any long volatility participants within the context noted below:
UVXY Shares at $12.50 X 1,000 shares long = $12,500. Now, $12,500-40% = loss of $5,000. Take reverse split of 5:1 from $7 a share to $35 a share: Your 1,000 shares split become 200 shares. $35 X 40% gain X 200 shares = $2,800 gain. You still have another $2,200 to make up from original loss and pre-split.
The verbiage/warning for going long or remaining long into a reverse split for VIX-leveraged ETPs that express long-term decay can be eye opening for newcomers to the instruments. If you hold a long position through a reverse split you’ll require a greater percentage move to break even or find the desired profit outcome. The percentage gain won’t equal the dollar gain on a lesser share count post a reverse split that one previously modeled. Furthermore, long participants will need to allocate more capital due to the higher share price post a reverse split if they so choose to dollar cost average in an attempt to mitigate potential losses. With the caution being articulated, the logic provided and even an equation to work off, investors and traders may better understand why I refer to these VIX-leveraged ETPs that decay in price as “short instruments”. They maintain an intrinsic design to be best utilized short.
Last week was, yet again, a very interesting week for the markets as oil troughed and began to rise once again. Economic data proved innocuous with the final reading of Q1 GDP being revised slightly higher to 1.4% from 1.2% in the previous reading. Higher is good, but it was still the worst performance since the second quarter of last year. The main reason for the bump in GDP was due to a revision to consumption. Consumer spending rose at a 1.1% rate, the weakest reading since the second quarter of 2013, but almost double the 0.6% reported last month. Bottom line with regards to both measures of economic activity, this is what you get in a maturing or matured bull cycle that is absent fiscal stimulus and the widely hoped upon tax cuts that have been proposed. It’s not too hot and it’s not too cold, but as it pertains to S&P 500 earnings it is “jussssttttt right”! Having entered the month of July that means the second quarter has ended and in the coming weeks we will be well into earnings season once again. And it couldn’t have come at a better time!
Coming into the week that was I had a plan in place as I generally have to at the end of any quarter. Fund managers do a lot of rebalancing at the end of quarters. They lock in profits by selling a good deal of positions while adding very few new positions. Net/net this expresses more selling pressure on the markets, usually. With this in mind on Monday I lightened Golden Capital Portfolio’s UVXY position by 10,000 shares. I offered this publicly on StockTwits and through my Twitter feed in real time. Below is a review of my StockTwits post and dialogue as to why I covered some UVXY shares on June 26, 2017.
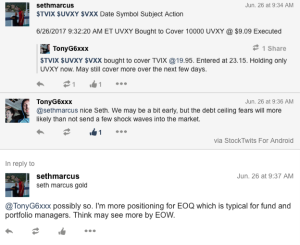
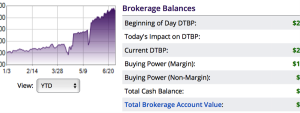
With the anticipated selling pressure I also anticipated a bump in volatility. The markets were up and down all last week with the Tech Sector finding the greatest selling pressure and the Financial Sector finding buyers, as the Fed finally allowed for banks to issue buybacks and dividends. Sector rotation was in full swing and the tug of war between the major averages moving higher, then lower, then higher once again found volatility moving in tandem. And with volatility providing opportunity, I was able to recapture all 10,000 shares of UVXY covered at $9.09 on Monday, later in the week for upwards of $9.88 a share. Additionally, I was able to trade short, shares of VXX from $13.89 down to $13.0633 a share. Despite the volatility and trading environment, Golden Capital Portfolio found its first negative week in quite some time. Having said that, the fund only dropped by .2% and still expresses a 97% return on capital invested for fiscal 2017…so far. Below is a snapshot of the funds brokerage account ROIC YTD.
As noted earlier, last week was another interesting week for the markets and VIX-leveraged ETPs. VIX-leveraged instruments continue to gain in popularity as their intrinsic design depicts a long-term conclusion that is undeniable. While the verbiage “long-term” can be subjective in definition the end result is nonetheless the same and not left to chance.
Volatility has a nature and while it is often said that volatility “mean reverts”, I continue to offer that this is an incomplete characterization of volatility. I’m of the opinion that volatility desensitizes over time and as such will always seek out new lows. When it hits those new lows is anybody’s guess. Most recently, Spot VIX hit an 11-year low below 9.40. My hypothesis may falter or prove on many variables, but I would offer that the human psyche defines volatility and as such I’m quite confident that one day the VIX will express a new all-time low. Being the first person to refute a widely held concept such as volatility mean reverting is akin to walking on thin ice, but more and more articles and research are being conducted as volatility and VIX-leveraged ETPs gain in popularity.
Last week, I found ZeroHedge positioning an article titled “Honey, I Shrunk The VIX". The article attempts to uncover the less than normal levels of volatility in the market and reasons why for every spike in volatility the duration of the spike is less and less. The article also identifies the increasing level of participation with the VIX and VIX-leveraged ETPs.
Look, I don’t desire to find investors/traders comfortably complacent regarding shorting volatility. Just like any other investing strategy, there are rules and disciplines that must be followed for participating short volatility. So does it bring me any solace knowing that more and more individuals are shorting volatility? Ehhhh, let’s just say it doesn’t disturb me any more than it pleases me, kind of apathetic to the popularity. Maybe I’ve just being shorting volatility for so long now that I’m more surprised that it’s only now we find shorting volatility at greater participation levels. Having said that what was also surprising to me on Friday you might also find surprising. On June 30, 2017, UVXY traded roughly 115mm shares. The Spider S&P 500 ETF (SPY) traded roughly 107mm shares. This marked the first time ever that UVXY traded more shares than SPY. Vance Harwood of sixfigureInvesting.com identified the trading volumes in one of his tweets on last Friday.
I’m of the opinion that Friday’s volume acceleration for UVXY and like instruments was due to a number of factors converging that include end of quarter rebalancing, hedging in large volumes, covering short positions in large volumes, low VIX levels for extended periods of time and the earlier announced ProShares ETF reverse splits forthcoming. Of course other factors may have played a role in the volume acceleration. Buttttttt you’re probably more concerned with the forecasting from this activity and not the activity itself, as it may precede greater market moves to come.
I’m of the opinion that the tech sector is a problem and the technicals don’t look promising for the S&P 500 Tech Sector, the Semiconductor Index (SOXX) or the QQQs. If the tech sectors can’t recapture loss momentum, but actually continue their recent sell-off, the major averages could be in trouble near-term. A good deal of the volatility participation could be in anticipation of what the technical indicators for the tech sectors are expressing as well as the potential for the Senate not being able to pass healthcare legislation. But that is why I’ve also suggested that earnings season couldn’t have come at a better time. The fundamentals for the tech sector have been and are expected to remain strong through this earnings cycle. If this expectation is met, the technicals may prove erroneous and find the S&P 500 Tech Sector, SOXX and QQQs rebounding after a brief consolidation period. Have fingers, will cross! Otherwise and as always, maintain optimal levels of liquidity to participate for greater volatility in the markets!
If you’re anything like me, you find yourself watching Bloomberg, Fox Business News and/or CNBC every trading day. The media is a great source of information, news and even ideas for investing and trading. For all of the ideas they offer each and every year, the following snapshots identify what the best and worst performing ETFs have been in 2017…thus far.
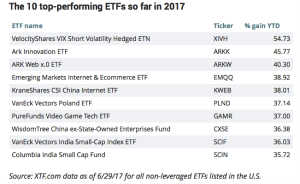
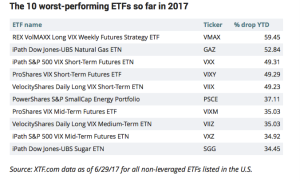
Notice anything interesting about both lists? If you’re not participating with a volatility investing strategy you’re probably underperforming those who are participating with a volatility strategy. With that, I wish you all a great trading week to come and a happy/safe 4th of July.
Disclosure: I am short UVXY


Good stuff.
Memorable content and education. Thank you so much!
It doesn't impact the point you're making but your example on page 1 isn't 100% accurate. After a 40% loss, and before the reverse split, the share price is $7.50 not $7.
The percentage gain required to break even is the same before and after a reverse split. Perhaps your error in concluding that it is more difficult is due to the initial "rounding" error.
It makes sense that percentage move is irrelevant to how many shares since we are starting with a total investment value that is identical in both cases.
Thank you for the comment Paul. Understand that I tried to initiate the equation as a form of practicality. As such the equation does not read $12.50-40% = $7. The $7 merely represents the decided upon split price for the sake of the narrate. Practically, we have no way to know what the share price will be the evening before the actual split takes place. The equation I offered simply sets parameters for simplification and under practical use. Moreover, I wouldn't be able to define one's trading from $12.50 down to $7 mark and equate a loss absent the parameters I set. For clarity I basically offered the acquisition price and share count, an unrealized loss at which point I set a reverse split at $7 to occur. Hope that helps and best of profits to you. Thank you again!