
Postcards From The Florida Republic - Labor Day Edition
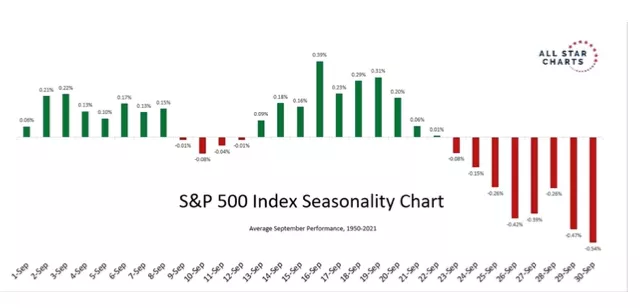
Current Outlook: As expected, we hit 390 on the SPDR S&P 500 ETF (SPY), ricocheted back to 400, and then turned lower. In September, seasonality is mixed, goes positive by Quad Witching, and then tanks at the end of the month. Expect the market to be very choppy for a while. I expect short squeezes and Bull Traps like Thursday afternoon and Friday morning to continue. But don’t worry… there’s plenty of pain left to come in 2022.
(Click on image to enlarge)

Stay Hungry: The “inverse” playbook remains in place. TZA, FNGD, BNKD, TECS, SH, SOXS, LABD, SQQQ, and SPXS. I’m largely avoiding the energy sector right now, mainly because two arguments contract each other on price direction. I’ll steer clear and keep taking calculated shots as ETF flows accelerate. But I will say I'm leaning more bullish on oil.
Current Mood: Calmer Than You Are.

Dear Future Florida Republic Residents,
I’ve said one important statement that few say out loud…
I’ve said it almost every weekend for about six months.
We’re in a financial crisis… It’s just the beginning.
And not enough people are acting like it.
This will not be a very rosy read today. It’s bearish.
And it’s from a trading perspective… not a long-term buy/hold.
I’ve had an extra day to think, an extra day to compile data, and an extra day to read. So, stop now if you’re looking for a traditional Wall Street voice to tell you the “Bottom is In.”
There is very little that I want to own right now.
It feels like September 2008 or November 2001.
Our leadership is flatly denying real problems. Not just in the United States but also around the globe. If one chart tells you how faith continues to collapse, consider my offering below.
After 13 years of near-zero percent interest rates, an unholy amount of central bank asset purchases, trillions in stimulus for everything from emissions reductions to COVID business relief, and rampant speculation in every asset, from homes to the downright silliness of NFTs… the bond markets cry “No more.”
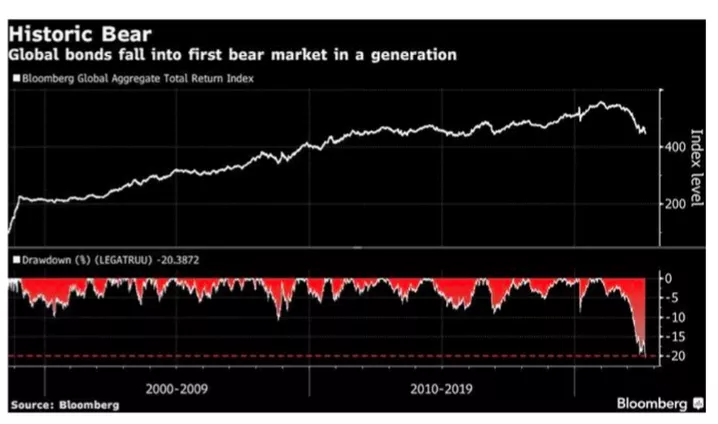
For the first time in a generation, global bonds have fallen into a bear market. And we’re only in the early innings of central banks raising interest rates and reducing their balance sheets – circa the Fed in 2018 – as economies fight inflation.
Golly… it’s almost like we’re in a financial crisis.
The bond markets are behaving as they should in these times.
And the stock market has provided plenty of “forward” clues.
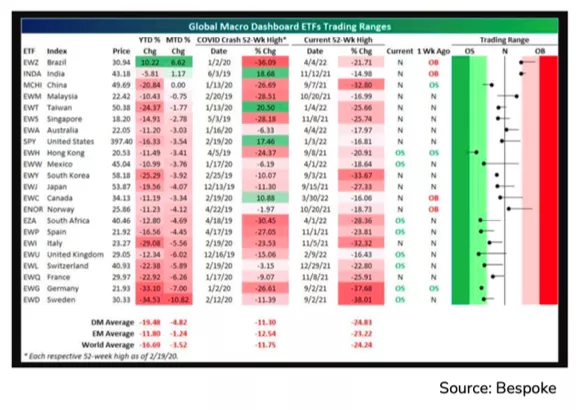
Country exchange-traded funds around the globe continue to melt…
(Click on image to enlarge)
We’ve only seen more “3% or more” daily moves on the S&P 500 during years when we were experiencing financial crises.
I wonder why more people in media aren’t writing more about it…
What could be the reason…
You probably guessed the obvious. Politics.
I’ve learned never to blame malice where ignorance could clearly be the reasonable answer. That’s my subject for this Labor Day.
There remains a widespread yet basic misunderstanding of how markets and economies work and the lasting impact of the Fed.
But… we start with momentum.
Momentum in this Market
We turned negative on the S&P 500 on Friday morning, Aug. 26.
That spurred my latest move to cash.
The following week, we saw a move from 418 to 390 on the SPDR S&P 500 ETF (SPY). That was a 6.6% decline that we avoided.
Broader market momentum went Red on Monday morning.
That’s where we started shorting the market more aggressively.
As I’ve said… we’re in a financial crisis.
We’re not acting like it.
So, we must look for clues into how markets trade in these environments. Bear markets… careening into a recession.
We can start with 2001. As you can see, we had multiple large bear market rallies from 2000 to 2002.
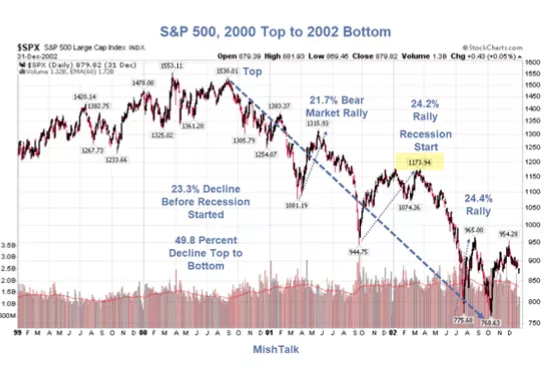
I’ll start loading up for a possible short-term bounce if we get a capitulation moment. But we’ll wait for the data.
And then we turn our attention to the 2007-2009 market moves.

You’ll notice that the markets don’t go in a straight line down.
They bounce thanks to the machinations of the markets. Call them bear market rallies, bull traps, or short squeezes. It doesn’t matter to me. We must find a way to spot them.
Even March 2020 wasn’t a straight shot down during that crash.
The pattern this year is lower highs and lower lows… in crisis.
(Click on image to enlarge)
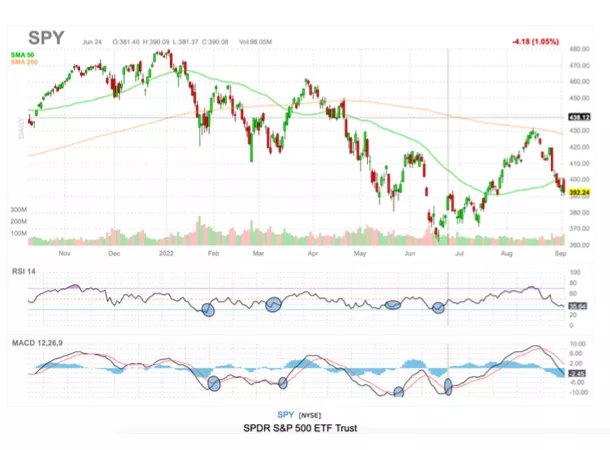
In a year like this, I’m seeing short-term pops transpiring during the Weekly Reading of the SPY on RSI + MACD. This is all replicable on FinViz – on the Daily SPY chart. It’s free.
These circles above do not align directly with official momentum switches – as the most recent came a month after the June lows.
However, I’ll note that the MACD has remained a reliable indicator that a low-volume rally may soon begin. I’ll look for a positive swing on the MACD, which is likely set to accompany a 14-day RSI level on the SPY at “oversold” levels around 30.
I’m not talking about a day this week when a relief rally – like what we saw in negative conditions occurs.
This isn’t exactly what I focus on… but given the track record of the markets in 2000-01, 2008-09, and 2020…
I might as well trade.
What else am I going to do?
Build a birdhouse?
Just Add Solar Panels, Man
Bloomberg continues to bark that our outdated grid can’t bring us all that great wind and solar panels. Yes, no kidding. Because the amount of infrastructure is larger than these writers can imagine. We also need batteries for storage – everywhere. We can’t print all this copper and lithium. This is a slow-moving, centrally planned disaster in the making.
For now, I only “trade” lithium, infrastructure, and other names in the clean energy space. I’m currently shorting Charge Point while momentum remains negative. What’s the point of owning an unprofitable company trading north of 20 times sales?
Momentum.

Learn it. Know it. Live it.
Wait… What Do You Do, Again?
So. Hi, I’m Garrett.
If you haven’t read Postcards before, sit down. Have a drink.
Relax.
One thing I don’t worry about… is getting crushed by the stock market.
I know that sounds absurd and overconfident…
But I focus on “momentum” in the S&P 500 and the broader market.
In real-time, we measure when capital is coming into the market and when it’s leaving… fast.
Why does this matter? Look at recent examples of bear market rallies that kicked right back into selloffs.
More important, let’s look at what we discovered in “real-time” versus what we would only learn in the media three or four days after the selloff.
On April 6, our momentum measurement went negative. I moved to cash.
I then bought a lot of puts on the Russell 2000 and Charge Point. We put some cash into the Dollar Bullish Index (UUP) – which rose as capital left the market and the dollar increased.
A week after the SPY fell from 458 to 426 (a 6.9% drop), we had just experienced the largest outflows among ETFs since 2018.
On June 8, our momentum measurement went negative. I moved to cash. This time, I bought puts on the Russell 2000 and Charge Point (CHPT). We put some cash back into the UUP. Same result.
Six days after the SPY fell from – 412 to 376 (an 8.7% drop), we learned that hedge funds engaged in their largest selling in about 15 years. That’s where a low-volume bear rally started.
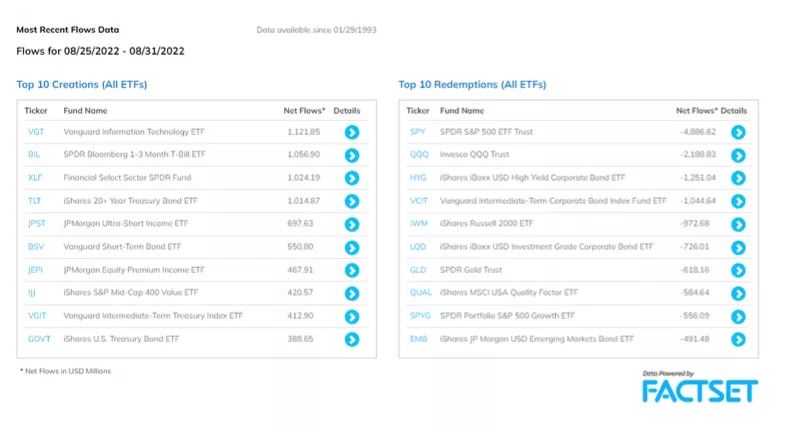
On August 22, this momentum calculation went negative. I moved to cash. This time, I bought calls on the S&P 500 Short ETF (SH), calls on the Triple-Bear QQQ (SQQQ), calls on the Triple-Bear Small Cap Index (TZA), and – as always – Charge Point. I expect the UUP will get to 30 soon as the dollar continues to roar… and liquidity issues are starting to flare up again.
On Thursday, we learned again about large outflows in the ETF market and a continued effort among hedge funds to short.
(Click on image to enlarge)
And when it goes positive – as it did on March 16, May 24, and July 19-I’ll go long SPY and start trading unprofitable stocks.
That’s the trade. It’s boring when you think about it—waiting around for a color to go Green or Red. But I can say that we’ve missed five selloffs this year and found four short-term bottoms. This isn’t rocket science.
It’s basic addition and subtraction.
If you are interested in the wealth of academic research around momentum, I highly recommend this library of influential academic and institutional insight.
They include - but are not limited to:
- The 52-Week High and Momentum Investing by Thomas George and Chuan-Yang Hwang (2004)
- Profitability of Momentum Strategies: An Evaluation of Alternative Explanations by Narasimhan Jegadeesh and Sheridan Titman
- Quantitative Momentum: A Practitioner's Guide to Building a Momentum-Based Stock Selection System by Jack R. Vogel and Wesley Gray
- The Value and Momentum Trader: Dynamic Stock Selection Models to Beat the Market by Grant Henning (2009)
- Profitable Momentum Trading Strategies for Individual Investors by Bryan Foltice (2015)
- Multiple Discriminant Analysis of the Price Momentum Anomaly and Reversal Event Signals by JD Henning (2016)
- A Case of ‘Wag the Dog’? ETFs and Stock-Level Liquidity by Daniel J. Sandberg (2018)
Now then… let’s lighten the mood.
Let’s Talk about Interest Rates
The Fed is likely going to 3.75% by the end of the year. From there, interest rates should stay elevated for a longer period. That’s where the real fun and challenges begin. During every bear market back in 1987, the Fed cut interest rates. The Federal Reserve cannot do it this time because of inflation.
The current yield curve expects a 75-basis point hike in September. The markets expect a 50-point hike in November and a 25-point hike in December. I still think we’re going to 4%. One bad CPI print or a resurgence of higher oil prices, and we’re looking at 50 in December.
In a few moments, I’ll tell a story about someone who thought it was clever to use the argument that “inflation is global” to defend the current state of the economy and Biden’s policies.
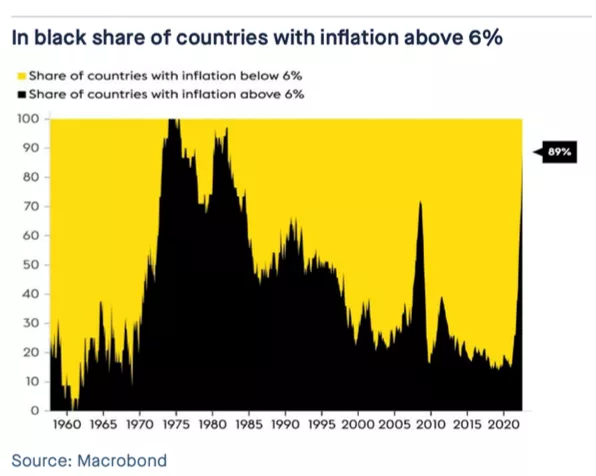
Yes. Inflation is global.
But the U.S. is ranked 92nd for the worst levels of inflation.
That makes the situation worse.
Because if the U.S. pushes rates higher and markets and liquidity weaken, the U.S. dollar will strengthen in a race to cash (creating severe debt problems for specific emerging markets that took on significant dollar-denominated debt.) We are witnessing multiple nations on the verge of serious economic calamity because of their exploding debt levels.
What’s above my pay grade is what happens to G7 nations like the United Kingdom. According to Goldman Sachs, inflation is expected to hit 23% in the United Kingdom this January. They’re likely charging 20 Quid ($23) per beer at pubs… or else the cost of electricity will drive these pubs out of business. There is a 1,200-year-old pub in the UK that is trying to survive…
Buckle up, friends.
Again… We’re only in the second inning of this drama.
Chart Party Time
I like charts. You like charts. Let’s enjoy charts together.
Chart No. 1: Own Nothing… and Like It
Well, look to the cross-asset holders and ask them how they feel about this market right now. According to this measurement from Bloomberg, we just saw the worst month in 41 years.
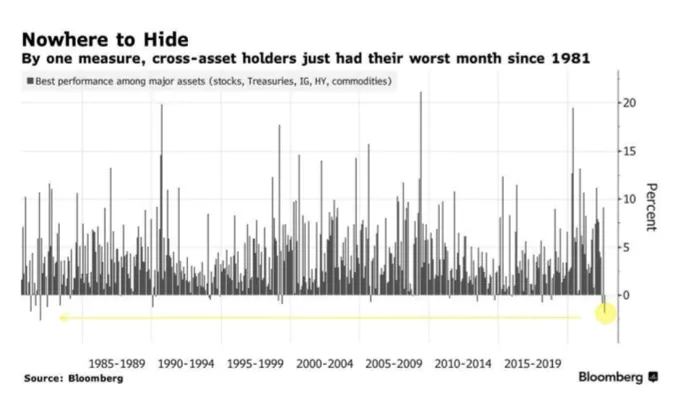
What’s Jim Cramer doing?
Calling another market bottom.
Oof…
Chart No. 2: Remember My Supply Warning
A few months ago, I went on an intense rant about the lack of supply-side solutions to improve our inflation outlook.
The ongoing effort to print more money or relieve consumer debt won’t alleviate much. The latest state was Pennsylvania, which wants to send out $2,000 checks to citizens to help them address “high prices.” Yeah. That’s how to “fight” inflation.
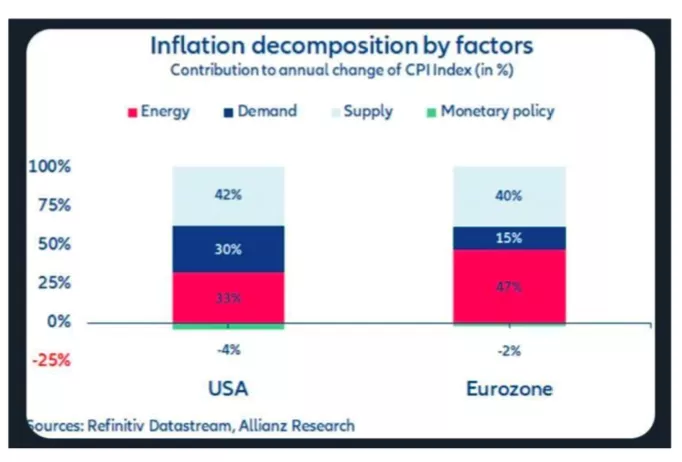
The crash in aggregate demand is what we should be watching… because that’s not the inflation problem now.
Demand has eroded. It’s the least critical inflation component in Europe and the United States. What happens when the Fed cuts rates… or we print more money or forgive more debt?
Aggregate demand will likely rise… in gasoline… in food… in cyclical consumer goods. What will then happen to prices?
Meanwhile, we have little long-term solution around solving Europe’s energy crisis… or the one we may face in the next few years due to the lack of CAPEX in the global oil patch.
But go on, Paul Krugman, and tell me it’s all working out and that inflation is going away...
Chart No. 3: Civil Unrest is Brewing
I thought that the food riots would be large this fall… But HELLO Europe. The likelihood of global unrest continues to swell, and we’re still in the first innings of this inflation crisis that will take years to unwind.
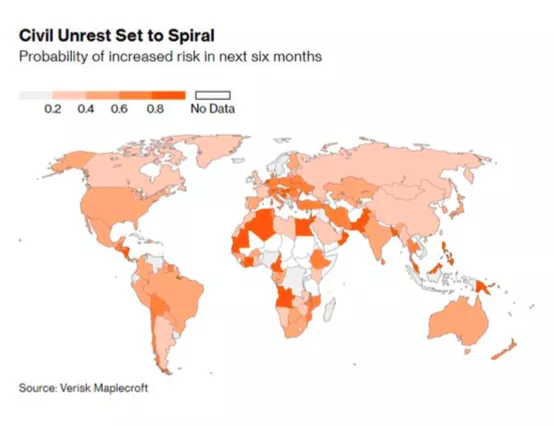
Alfred Henry Lewis said in 1906, “There are only nine meals between mankind and anarchy.”
There’s a reason I am building a farm.
Chart 4: Gas Problems
European gas prices are surging, and things are going from bad to worse. Vladimir Putin said today that the Nord Stream pipeline to Germany would not reopen until the West lifted sanctions against Russia over the Ukraine war.
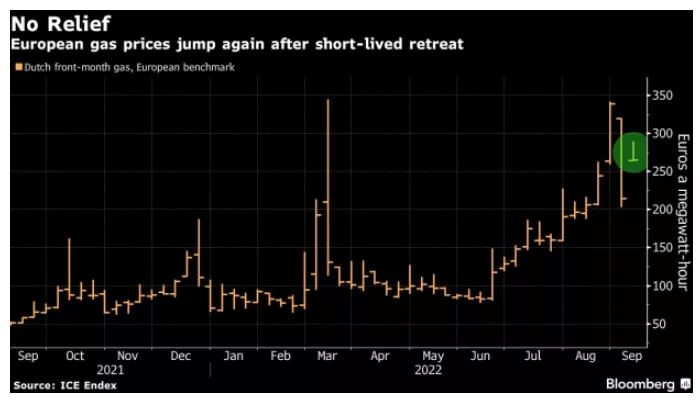
That will not likely happen given the G7 announcement to cap oil prices. So… now we have a situation on our hands that could shift the face of Europe forever. I’m still absorbing the news about the oil-price cap, so it will take me at least a week to digest the economic impact on a manufacturing nation like Germany. That said, the price of everything just went higher.
Chart 5: Europe’s Lehman Moment
The electricity markets will require emergency liquidity right now to prevent a possible Lehman Brothers moment for Europe…
And right here is where I present my bearish element…
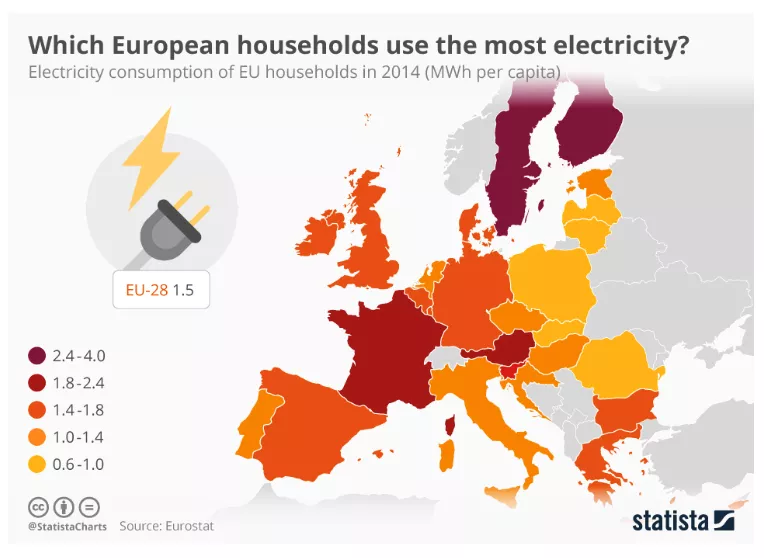
Finland’s economic minister sounded the alarm that the European energy system could experience a Lehman Brothers moment.
Wait… what? How does energy create a Lehman Brothers moment?
Simple. Leverage.
Energy traders hedge existing positions by selling commodity contracts against electricity purchased by customers. When someone sells a contract – like a put or a call – they need to provide a margin or collateral.
Here’s the problem. If they are hedging against the short-term market, their exposure is most significant when there is a dramatic price movement in electricity. That’s been happening across the entire continent. These companies are losing untold amounts of money.
When companies are getting crushed on positions, the other side of the party might call "margin" or demand more capital as insurance. The energy companies must sell assets and put up cash to make that possible.
The leveraged component drains their capital… which creates a liquidity crisis.
Without money falling from the sky to short up the paper markets, you put yourself in a situation where the electricity giant becomes insolvent… That’s where concerns about offering credit start to hit the private sector. Why would Credit Suisse or Deutsche Bank want to provide a line of capital – and we’re talking about a significant amount of money – if there is a growing fear of default?
The more volatility in the price of electricity, the more likely we would see margin calls.
Of course, Europe is considering suspending derivatives trading, price fixing, and more bailouts when inflation is at record levels. This is bonkers and the beginning of something much more intense in the months ahead.
And I didn’t even mention the fact that Germany’s entire economy is leveraged on the ability to manufacture on top cheap, accessible natural gas. Zoltan Pozsar of Credit Suisse noted in August that about $2 trillion in Germany’s economic value is derived from $20 billion in natural gas.
That’s incredible leverage…
Postcards from the Florida Republic
Last month, I had someone go on a long screed about the best “economic” Presidents of the last 30 years. They work in grassroots politics. I won’t go into why it became a bar subject.
For five minutes, they talked about GDP levels, deficits, tax rates, healthcare costs, and so on. It was a lecture…
I also learned that Barack Obama “saved” the economy in 2009. (Okay, I was told he did... but... I feigned initial surprise at this statement.)
After a long and tenuous history lesson about everything from the Affordable Healthcare Act to the American Recovery and Reinvestment Act of 2009, I finally got to ask a question.
“Are you familiar with Ben Bernanke?” I asked.
“The author?” they asked.
I’ll spare the rebuttal.
But this person didn’t know Ben Bernanke was the Fed Chair at the onset of the Obama presidency. They barely understood what the Federal Reserve is… or does. This explains the lecture.
Also, this person claimed that Obama was an “economic genius.”
I didn’t laugh. Not at the lack of knowledge of former Fed Chair Ben Bernanke and his beard… or that claim about Obama.
You see, people can claim anything they want.
I could claim Obama doesn’t know how to put his pants on the right way… but you need some facts to support similar hyperbole. So I offered a few.
I explained that Obama was up late at night in 2011 asking advisers why those "green jobs” promised in the American Recovery and Reinvestment Act of 2009 NEVER came to fruition.
I explained the scenario of low-growth, low-inflation numbers despite the Fed's massive levels of Quantitative Easing for eight years.
I gave Obama some credit. He didn’t implode the economy. It was an eight-year “recovery” marked by low inflation and low GDP.
But if you understand the Federal Reserve and monetary policy, you know the economy’s outcomes over the last 109 years.
Let’s draw a straight line between the Fed’s balance sheet and interest rate policies from 2002 to 2022…
How the Fed fueled everything from the post-dot-com “recovery, an ensuing Housing Bubble and 2008 Crash, the factors behind the “Obama Recovery” (Three Rounds of Quantitative Easing) with low growth and low inflation, the quantitative tightening of 2018, and ensuing market rebound in 2019 thanks to more easing, the $5 trillion response to COVID and ensuing market rebound, plus new rate hikes and balance sheet cutting now hitting the market.
I explained that every time the Fed aggressively raises interest rates (as it did in 2018), a crisis had formed somewhere around the world dating back to at least the 1970s… long predating my existence or bias or any planning of said existence by a decade.
The next question I get always starts with: “Well, what about…”
· What about the $787 billion stimulus?
· What about PPP?
· What about the tax cuts for the rich?
· What about the inflation reduction Act…
All questions I received over and over…
Don’t these matter to the U.S. economy? And to the stock market?
Allow me to retort:
· What about the weather in Houston?
· What about South Korea’s steel industry?
· What about mining strikes in nations most people can’t find on a map?
Some things involve injecting new capital into the markets… others indirectly through future cash flows and profits.
And all matter and have statistical relevance to market performance for day, weekly, and month-long trades…
Sure, I’ll discuss fiscal policy all anyone wants… tax cuts, tax hikes, stimulus, subsidies… I’m not dismissing executive or fiscal policy… it is essential.
But, the world economy has radically changed in the last 20 years thanks to dynamic shifts in monetary policy (rates/balance sheet) and how central banks command.
I’ve discussed the Fed’s balance sheet post the Dot-com bubble. It went from $200 billion to $9 trillion in 20 years.
I talked recently about former European Central Bank chair Mario Draghi at the 2014 Fed symposium and how central banks turbocharged their asset buying after his commitment to ending austerity and promoting European growth.
We could debate which statement produces the worse outcome…
- Ben Bernanke’s statement in May 2007 that “the subprime mess is grave but largely contained.”
- Or the 2021 statements by Powell that “Inflation is transitory.”
But most Americans don’t care.
They’re watching SEC Football this weekend. There’s a Doubleheader between the Orioles and the Blue Jays today.
This is stuff that maybe three percent of the population knows about… let alone cares about. And it explains – why everything is so clearly put through the lens of Left v. Right, who is in charge, and who is pulling the strings at any moment.
Few people understand the machinations of the Federal Reserve and its impact on financial markets – and the broader economy. The Fed’s cheap money policies of the last 20 years have fueled asset bubbles and overheated this economy.
The Fed’s policies deeply impacted the housing markets and cyclical consumer spending, which fueled recessionary and expansionary movements in the economy. You can’t say that the President affects that portion of the economy today more than Jerome Powell and his team.
I’d be a fool to suggest otherwise. So would you.
I don’t care who the president is. I have no control over the elections. I can only trade the outcomes and the policies.
I don’t see the world through the lens of left or right, Republican or Democrat, blue or red, not even rich or poor.
I see the world through “Up” or “Down” --- sink or swim.
And right now… RIGHT NOW.
We are taking on water.
Who’s Fault is It? “Capitalism… of Course”
A lot is happening right now.
But I want you to understand that every time the government and centralized planners create a crisis… they love to double down.
The energy crisis in Europe was driven by governments. Yet, you’ll hear them blaming energy traders and capital markets for the problem. That’s utterly insane.
This happens all the time.
Every government intervention, every centrally planned failure, every monetary policy mistake, every redistribution of government resources to one favored group from the treasury.
It always ends up with a desire to do more of the same.
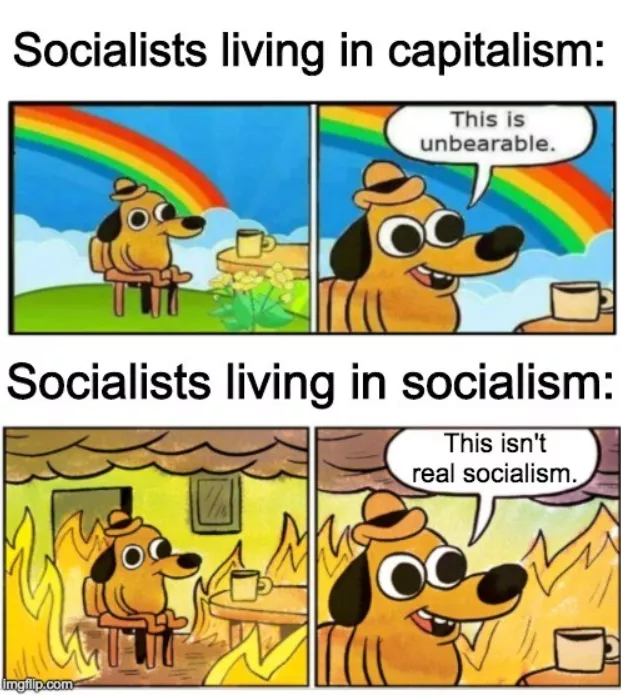
And ordinary people… thinking that this is what capitalism is…
They’ll end up blaming Capitalism… even when this nation hasn’t been capitalistic… well… I haven’t lived through it.
We are now the 25th most economically free nation in the world…
We were 10th in the Heritage Economic Freedom Index just a decade ago. We’ll likely be “less free” in the rankings by the time I’m 50, and who knows later…
But the useful idiots will still blame capitalism.
I encourage you to read this explanation and warning from the American Institute for Economic Research.
I point to Max Borders’ piece “Wait for It… “It’s Capitalism’s Fault!” to explain why the economy, national debt, and markets are unsustainable and why this isn’t capitalism.
So, what is it? Simple…
Central planning. Government intervention. Grift. Corruption.
I’ll discuss the latest nonsense out of California this weekend.
The Week Ahead
Here is the calendar for the short week ahead. Let’s enjoy your Labor Day by checking our work email a few dozen times…
Tuesday
- Tanking Trump: Not sure if this will help the entire social media world or help it and if investors are fools or geniuses? Digital World Acquisition (DWAC) will hold a new shareholder vote to decide if the SPAC can extend the deadline to complete a deal to September 8, 2023. These shares could tank quickly.
- The Code Conference is Tuesday. That should distract from the fact that technology stocks are falling apart. Alphabet, Amazon, Apple, and Snap’s CEOs will speak. Oh, and Pete Buttigieg will be there for some reason. I’m sure he’ll say something economically ignorant.
Wednesday
- Apple will hold its big event to discuss the new iPhone 14 lineup. It will also talk about its latest products. I’m looking forward to the stock bouncing back to $170 as people line up to “rent” a new phone from the company on credit and pay a massive “insurance fee” for the right. What silly consumers we are.
- The Federal Reserve releases its Beige book.
- Gamestop (GME) will report earnings. According to options prices, there is a 16% implied swing up or down. I don’t understand how or why this is still a thing.
Thursday
- Bausch & Lomb (BLCO) will see its IPO lockup period end. This will be an interesting trade.
- The ECB releases its interest rate decision. It’s unclear if they will go up 50 or 75 points. My bet is on 75 now, largely because of the rampant energy inflation cracking the continent.
- Powell will speak at the Cato Institute Annual Monetary Conference. What a boring name for an event. I’m sure the markets will overreact to Powell’s tie color.
Friday
- Nike (NKE) hosts its annual shareholder meeting. There will be much focus on government policy. Nike has proposed pausing the sourcing of cotton and other materials from the Uyghur Region, where forced labor operates. Nike has said it doesn’t “directly” source these materials from the region.
More By This Author:
Three Overvalued Tech Stocks To Sell Right Now
Two Stocks to Sell First Thing This Morning - Zoom Video And Peloton Interactive
The Best Small-Cap Stock To Buy Right Now Could Hand You A 50% Profit
Disclosure: None.


