Not A Wobble In Sight For These Indices
At this point, what is there left to say, really? The simple engine of (a), trillions of Fed dollars leading to (b), ceaselessly higher equity prices continues to work with the certainty of magic.
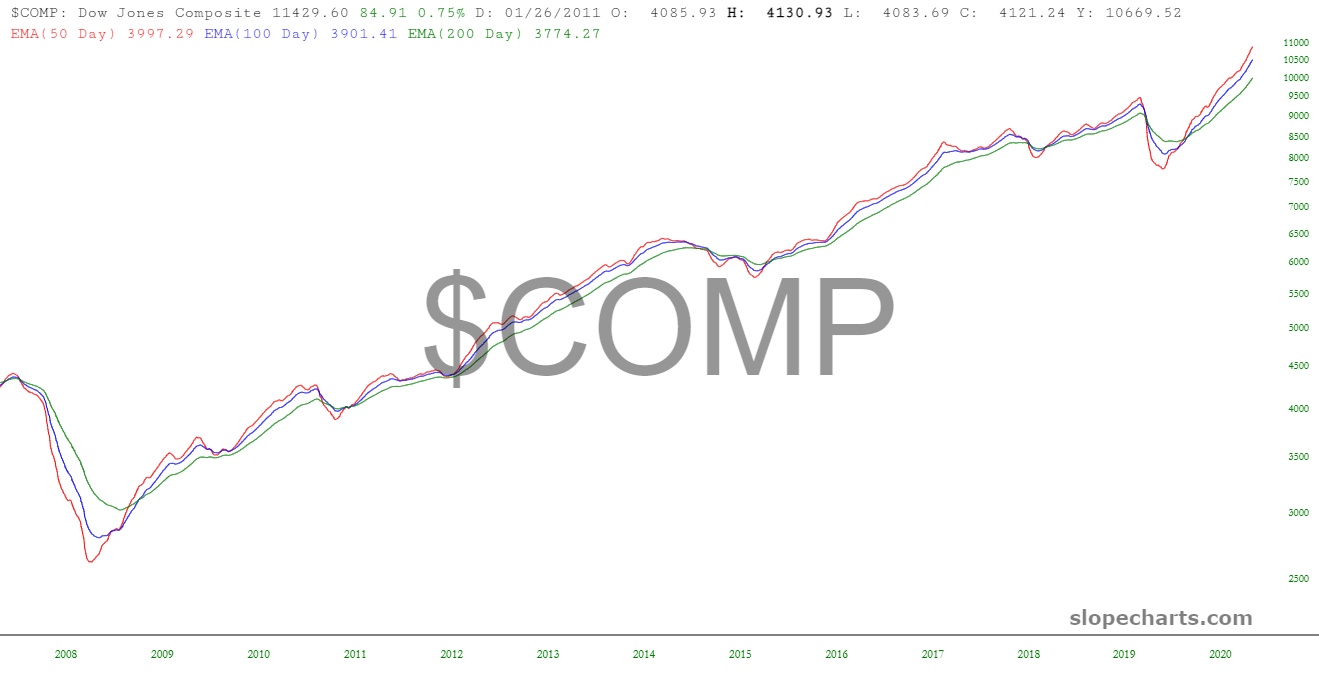
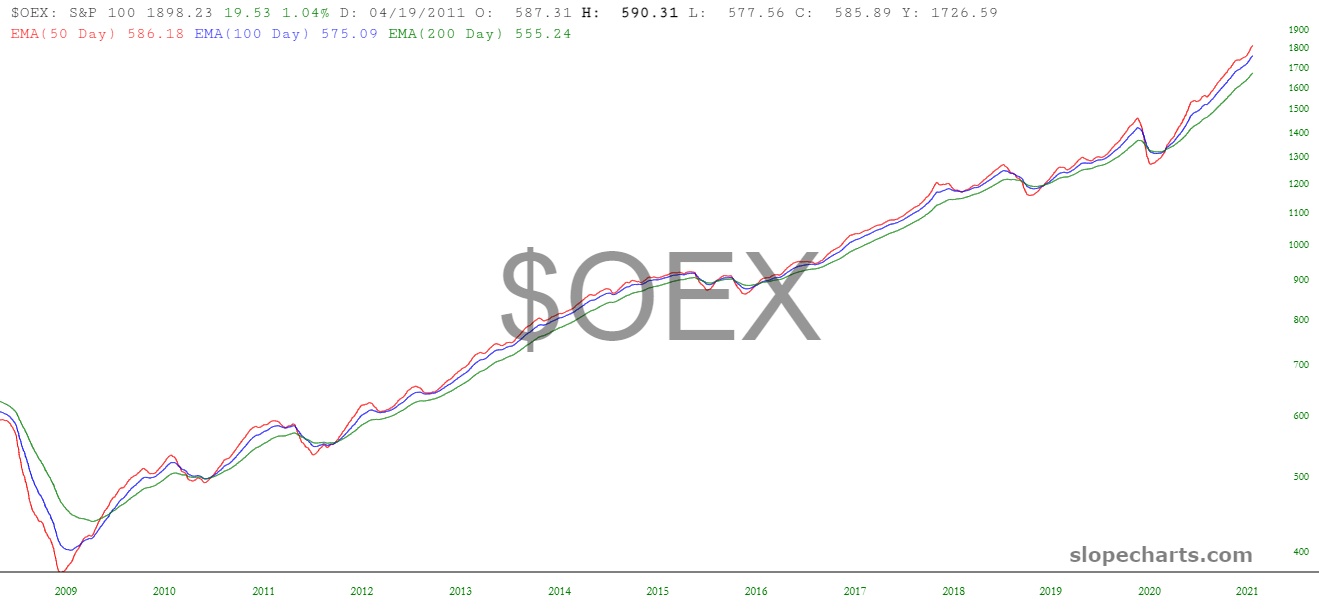
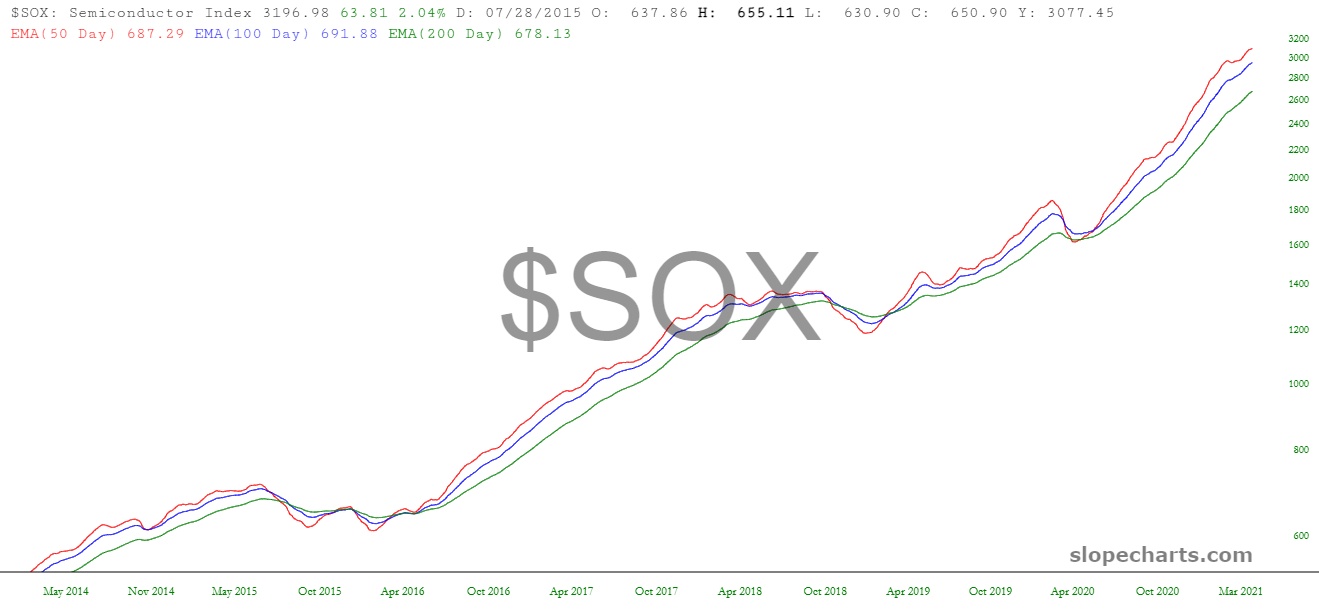
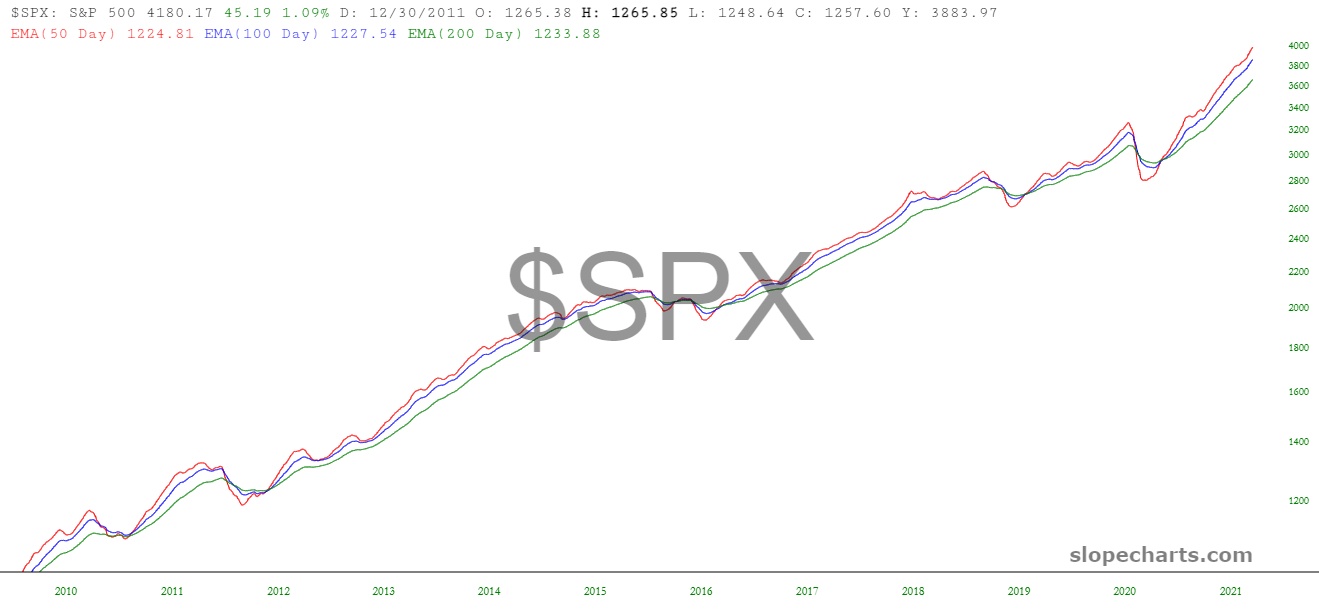
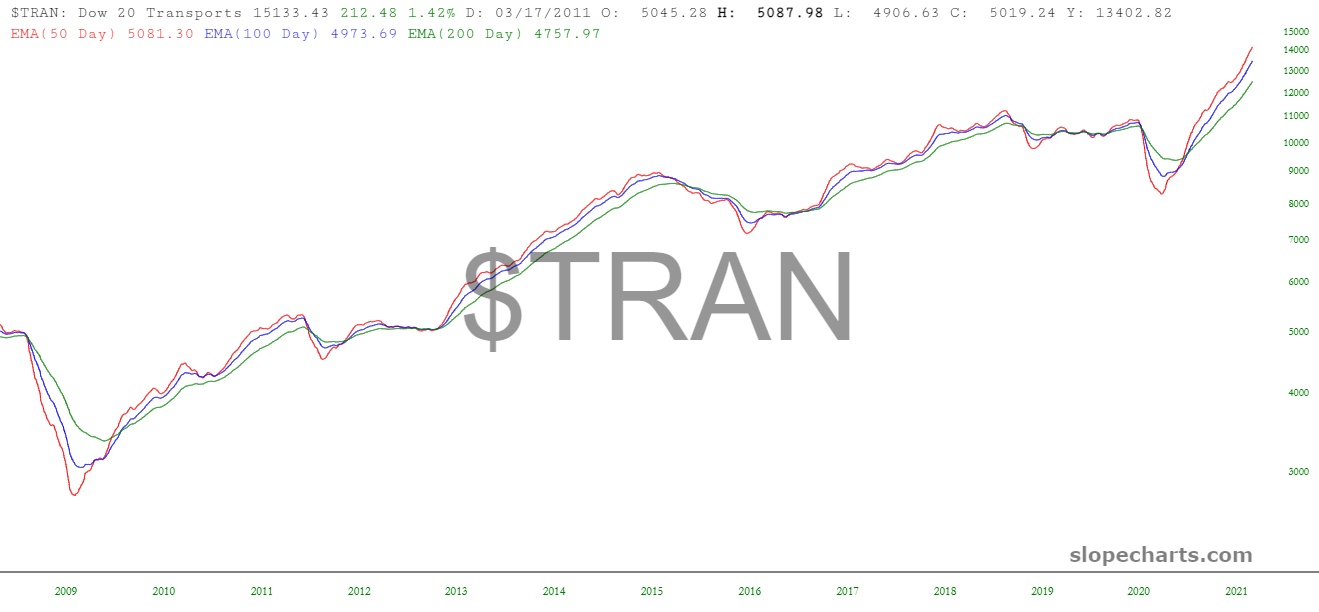
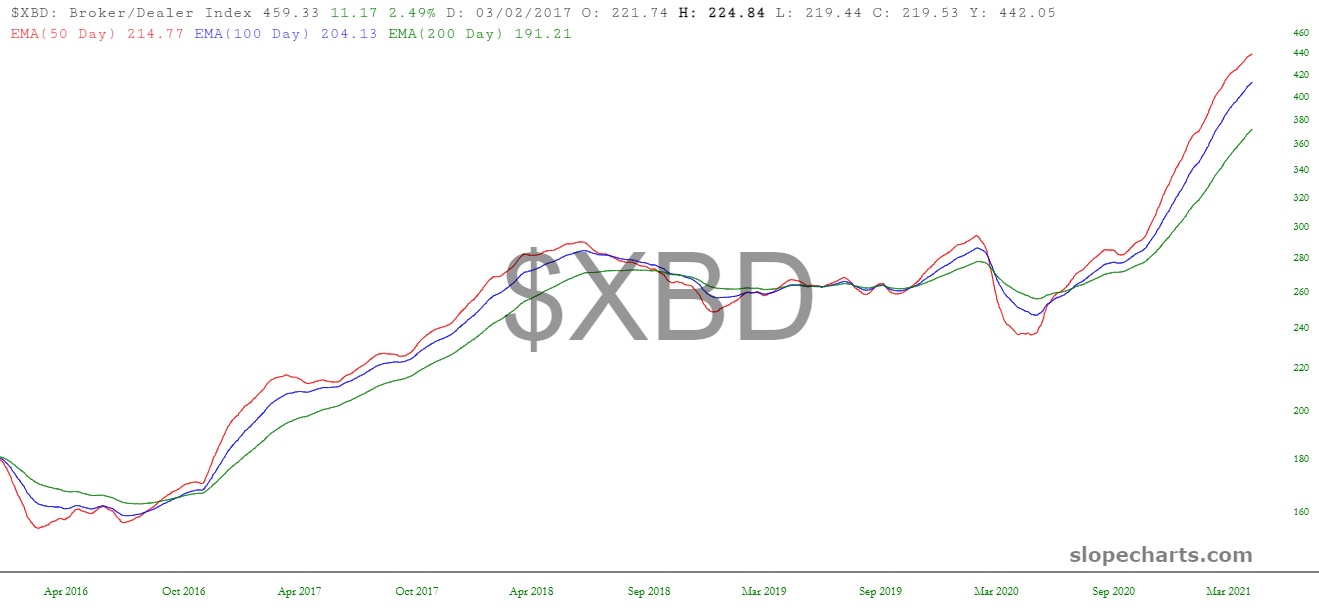
Below is chart after chart of major U.S. equity indexes, stripped of their price data and purely illustrating the trio (50, 100, 200-day) of exponential moving averages. The ascent in recent months isn’t just smooth; it is relentlessly powerful, and none of the lines are even bothering to threaten a bearish crossover. Just look at this circus:


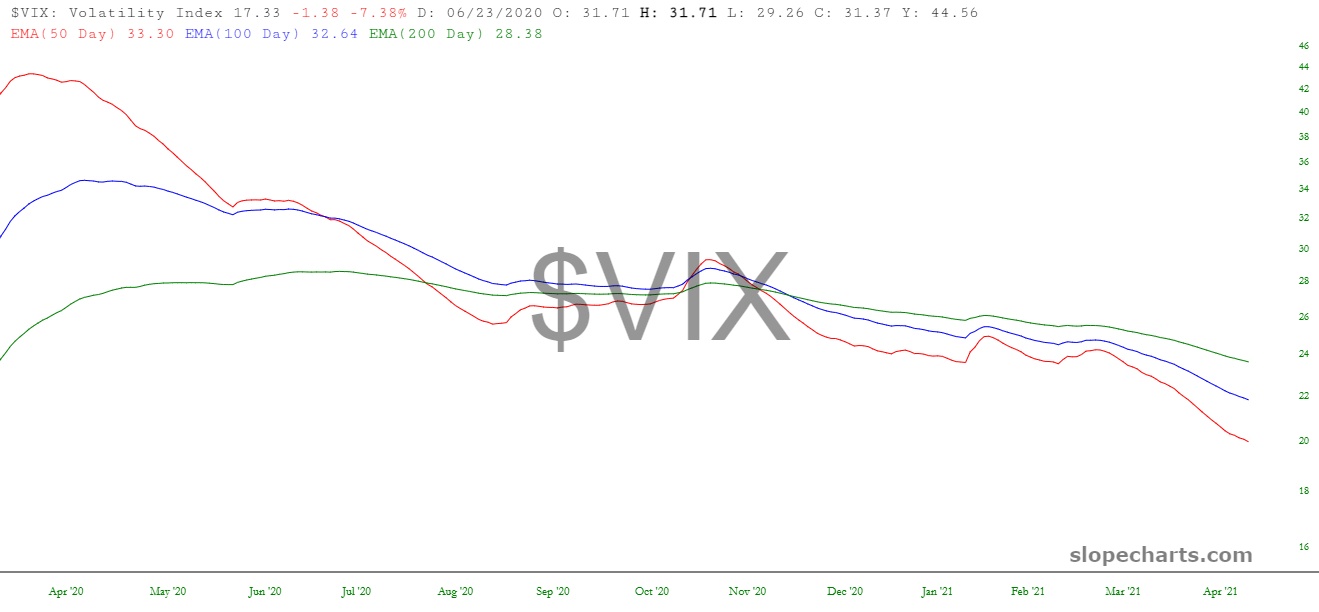
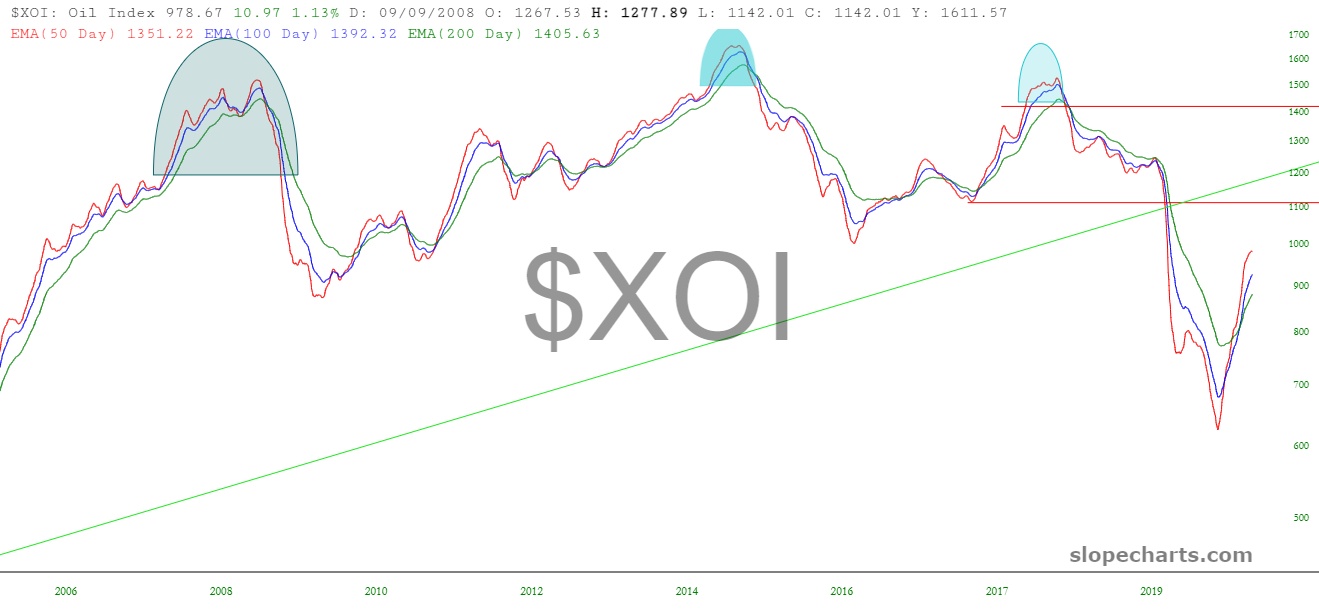
I will admit that there’s one place that might be in for some serious swooning, but honestly, this is about it:
But, in the end, there’s only this chart which is practically having a bear market of its own, and that is the market of rational fear.