Negatives To Watch In A New Short-Term Uptrend

Image Source: Pixabay
The chart of the SPX continues to look really good, and now this major index has closed at a weekly high. In addition, the number of NYSE new 52-week lows remains at harmless levels.
Here is a look at the same index, but with a 21-day EMA. I'm showing this chart because the 21-day EMA is the focus of the technical commentary at Investors.com. Notice how nicely the SPX price has respected the 21-day trend both on the way down in March and on the way up starting in May.
At Investors.com, the thinking is that as long as the price holds above the 21-day moving average, stay focused on trading the uptrend. However, once there is a breach below the 21-day moving average, start to get defensive.
The lower panel is also helpful. The 5-day average of net highs and lows looks like added assurance regarding the trend.
On Thursday, June 26, the PMO index ticked upwards and helped signal a new short-term uptrend.
The major indexes all started trading above the 5-day averages early last week. A new uptrend can't start, in my opinion, until there is a close above the 5-day average of the major indexes.
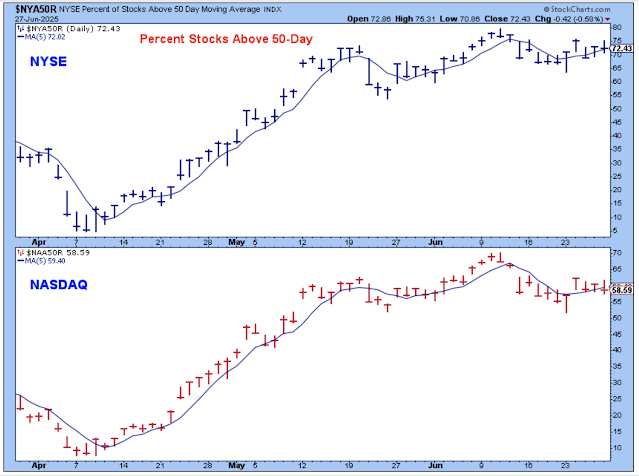
The percentage of stocks trading above their 50-day averages is a bit disappointing. This chart is used to help confirm the new trend, and, unfortunately, although it isn't particularly negative, it isn't very positive looking either. For now, I won't make too much of this.
Similar to the chart above, the bullish percents didn't respond much to the change in trend. This chart didn't move much during the short-term downtrend, and it hasn't moved much yet during this new uptrend.
Same here for the Summations.
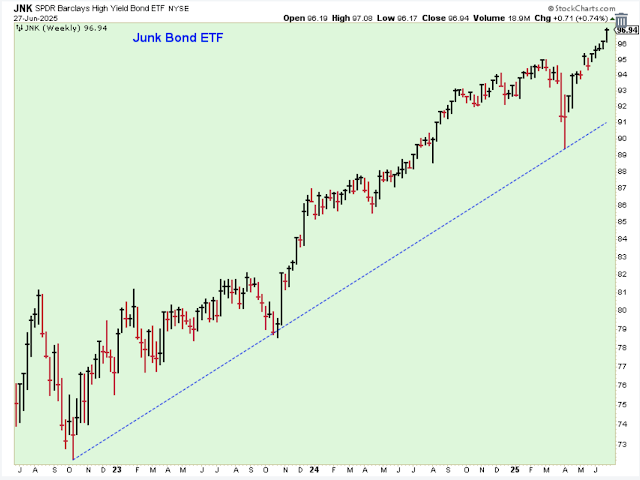
The junk bond ETF continues to move higher, confirming that holding stocks is the right thing to do at the moment. This ETF had a good week.
These are the two ETFs that really drive the market. It might make some sense to throw out all the other charts and indicators and just follow the trend established in this chart. When technology stocks are moving higher, so are the major indexes. Simple as that, and vice versa; if these are weak, then so is the broader market.
As you can see, these ETFs broke above their 200-day averages and have continued to look strong.
Here is a look at the same ETFs, but with the charts now showing the 21-day EMA averages. They look very nice.
The market looks good, but there are a few negatives. This chart shows the SPX hitting new price highs in the lower panel, but the corresponding cumulative AD line is below its highest level from late last year. This is a negative non-confirmation.
This chart is very concerning. The number of stocks trading above their 200-day averages is weak, and in such a strong market, this chart should not look like this. This chart tells us that the general market has been rising based on the strength of a minority of stocks. In other words, market breadth and participation are not good. This is a bearish indicator.
Bottom Line
I am following the market leadership and buying stocks in the strongest areas of the market. However, if there is any sign of weakness, like a close under the 21-day EMA, I will take defensive measures by raising cash quickly.
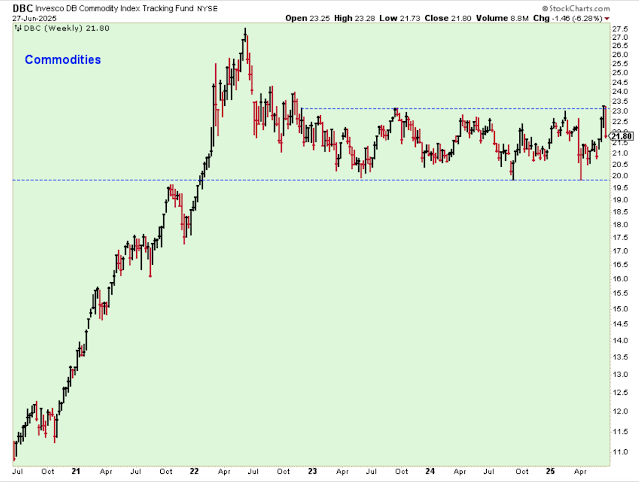
Last week, I mentioned the concern among market followers that commodities were starting to heat up. However, those concerns are seemingly now gone as oil prices and other commodities have retreated nicely.
Here is an ETF that had a very good week and looks poised for price appreciation. I'm an owner.
The group of stocks in this ETF also had a really good week. This is a good-looking breakout for a group of high-quality stocks selling at reasonable multiples.
Outlook Summary
- The short-term trend is up for stock prices.
- The medium-term trend is neutral for Treasury bond prices.
More By This Author:
The Short-Term Downtrend Continues As July ApproachesCalling A New Short-Term Downtrend
The Market Pushes Higher
Disclaimer: I am not a registered investment advisor. I am a private investor and blogger. The comments below reflect my view of the market and indicate what I am doing with my own accounts. The ...
more


