

Photo by Kanchanara on Unsplash
Nasdaq 100 could soon break below the support formed during October and November according to this leading indicator for growth stocks — ARKK ETF. Watch the video below to find out why ARKK is the go-to leading indicator to predict the Nasdaq movement based on the Wyckoff method.
Video Length: 00:11:53
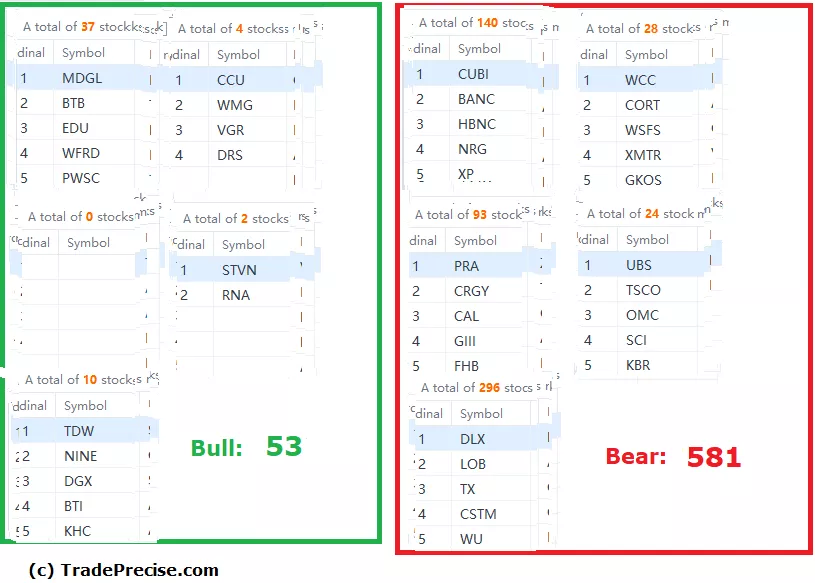
The bullish setup vs. the bearish setup is 53 to 581 from the screenshot of my stock screener below.
The inflection point showed up last Tuesday reacting to the CPI, which was the perfect short-selling entry. After several down days, S&P 500 is short-term oversold and could attempt to rally up. Traders could seek opportunities to sell on the rally for swing trading to the downside.
More By This Author:
More Bearish Ahead For Tesla: A Wyckoff Take
Bear Alert: Apple (APPL) Is Near Completion Of Wyckoff Distribution
Does Caterpillar Inc. Have What It Takes To Stay Bullish?


Comments
Log in or sign up to join the conversation.