Medium-Term Downtrend: Gold Miners In The Lead
Gold, silver, and mining stocks don’t need any help from the USDX or the stock market; they can decline all on their own – the miners in particular.
Last week, mining stocks declined quite visibly, and it happened without significant help from the USD Index and from the general stock market. Silver and gold were practically flat week-over-week, so was the USD Index, and the general stock market (S&P 500) was up by 0.51%. This means that gold stocks and silver stocks should have closed the week relatively unchanged (as gold and silver did), or move somewhat higher (similarly to other stocks, as sometimes miners take their lead).
Instead, all important proxies for the mining stocks moved lower and closed the week at new daily and weekly 2021 lows. The HUI Index and the GDX ETF were down by about 3%, the silver stocks (SIL ETF) were down by 3.6%, and the GDXJ ETF (proxy for junior miners) was down by 3.83%, which means that our short position in the latter just became even more profitable.
Most importantly, it means that mining stocks continue to show weakness relative to gold, which tells us that the medium-term downtrend remains well intact. It also tells us that what I wrote previously about the medium-term link between the general stock market and mining stocks was most likely correct. Namely, that miners can decline without a decline in other stocks. A decline in the latter, will (as I still expect to see it sooner or later) simply exacerbate the decline’s volatility.
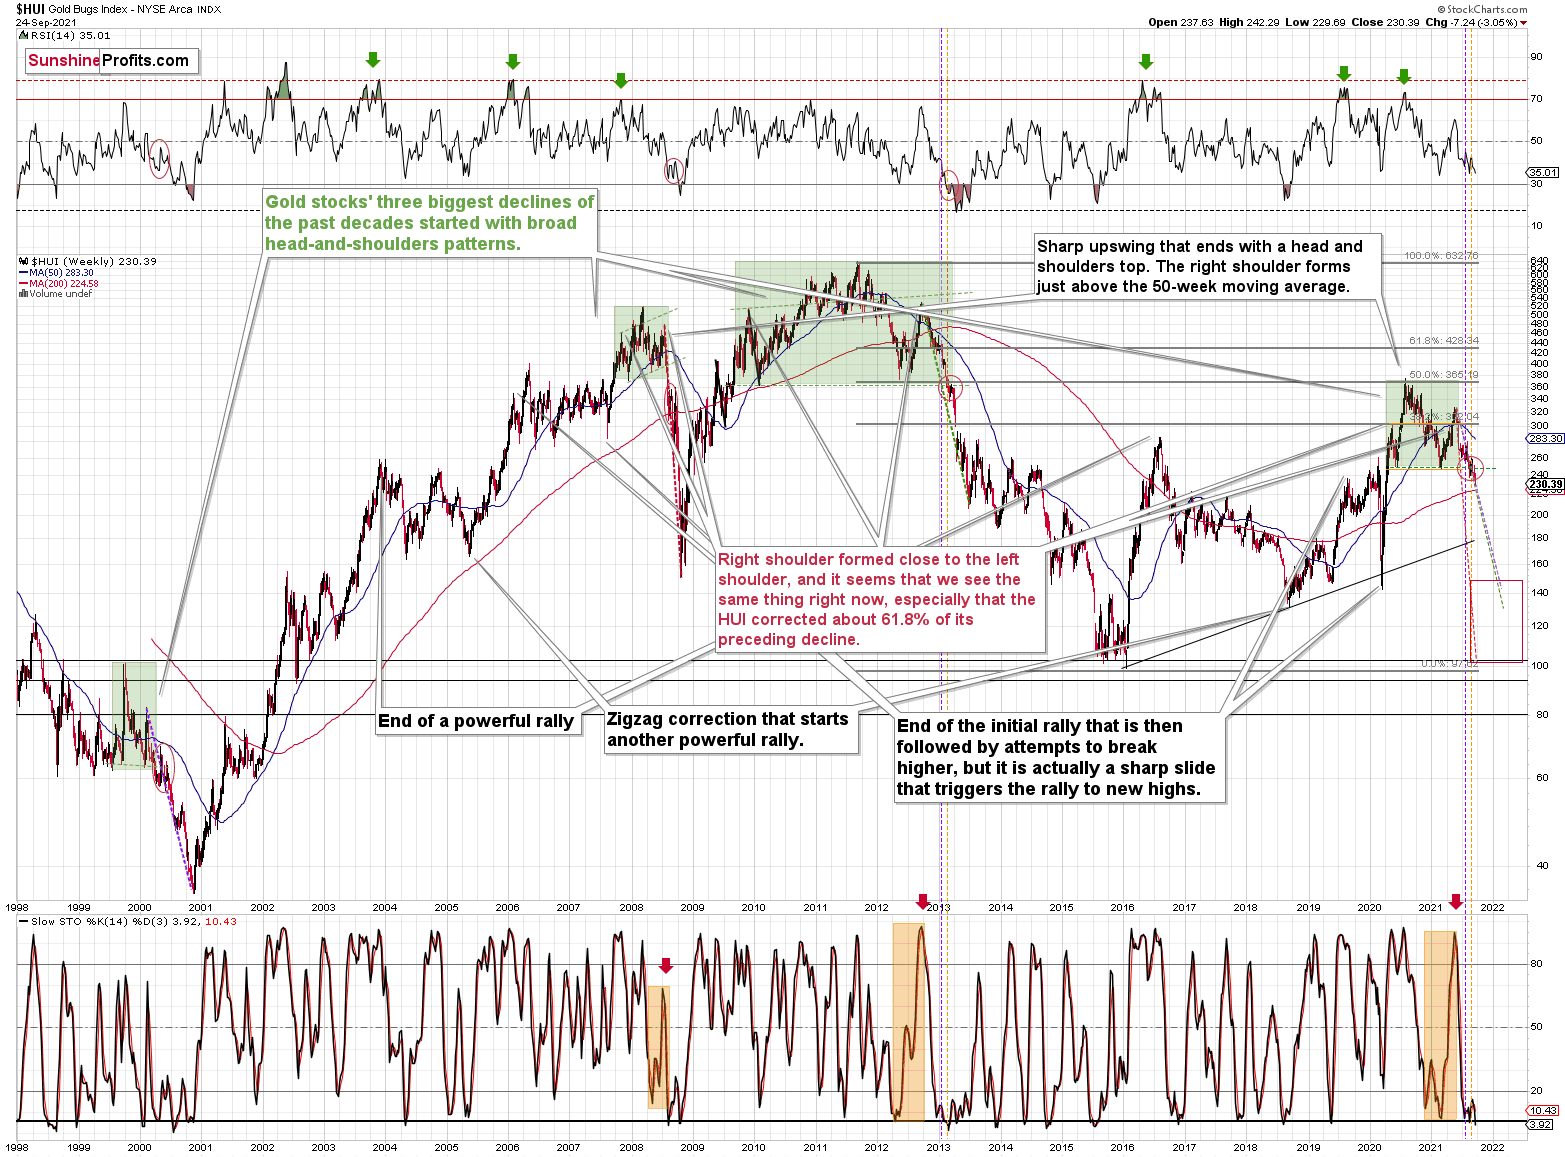
Let’s take a look at the charts, starting with the long-term HUI Index chart – the flagship proxy for gold stocks.
The clearest and most important thing that you can see on this chart is that gold miners continued their decline after completing – and verifying – the breakdown below the broadhead and shoulders pattern (marked in green). Just like in the case of the previous similar patterns (also marked in green), mining stocks are likely to now decline profoundly. The 3% decline that we saw last week is likely just a small beginning of the entire slide.
Yes, the Stochastic indicator is very oversold, but please note that it was the same in 2013 during the powerful post-head-and-shoulders-breakdown slide. And it didn’t cause the decline to end or reverse.
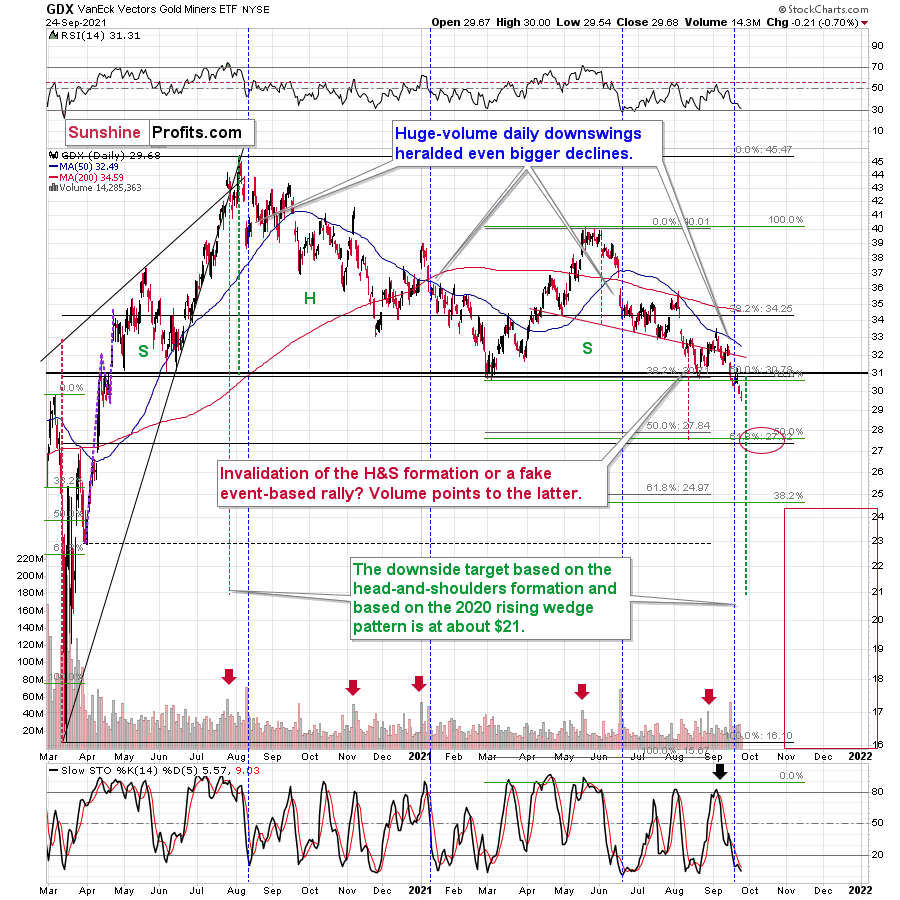
The breakdown to yearly lows is also crystal-clear in the case of the GDX ETF. The weekly close below the previous 2021 lows is critical, but it’s worth noting that it was also a close below the psychologically important (as its round) $30 level.
The next target for the GDX ETF is based mainly on the 61.8% Fibonacci retracement level based on the entire 2020 rally. The previous retracements worked quite well, so it seems that this technique shouldn’t be ignored.
The 38.2% retracement served as support in November 2020. The decline below this level triggered a short-term rebound.
The 50% retracement served as support in March and August 2021. This level was particularly strong as it corresponded to the previous – May and June 2020 – lows. Reaching this level triggered rebounds. The first one was quite significant, and the second one was of only short-term importance.
When the GDX ETF moves to its 61.8% it’s likely to rebound in the short term (and probably in the short term only), not only because of the retracement itself, but also because two additional techniques confirm this level as a short-term target. One is the support provided by the late-March 2020 high, and the other is the previous head and shoulders pattern that formed between April and early August 2021. Based on the size of the head (red, dashed lines), GDX is likely to decline to about $28.
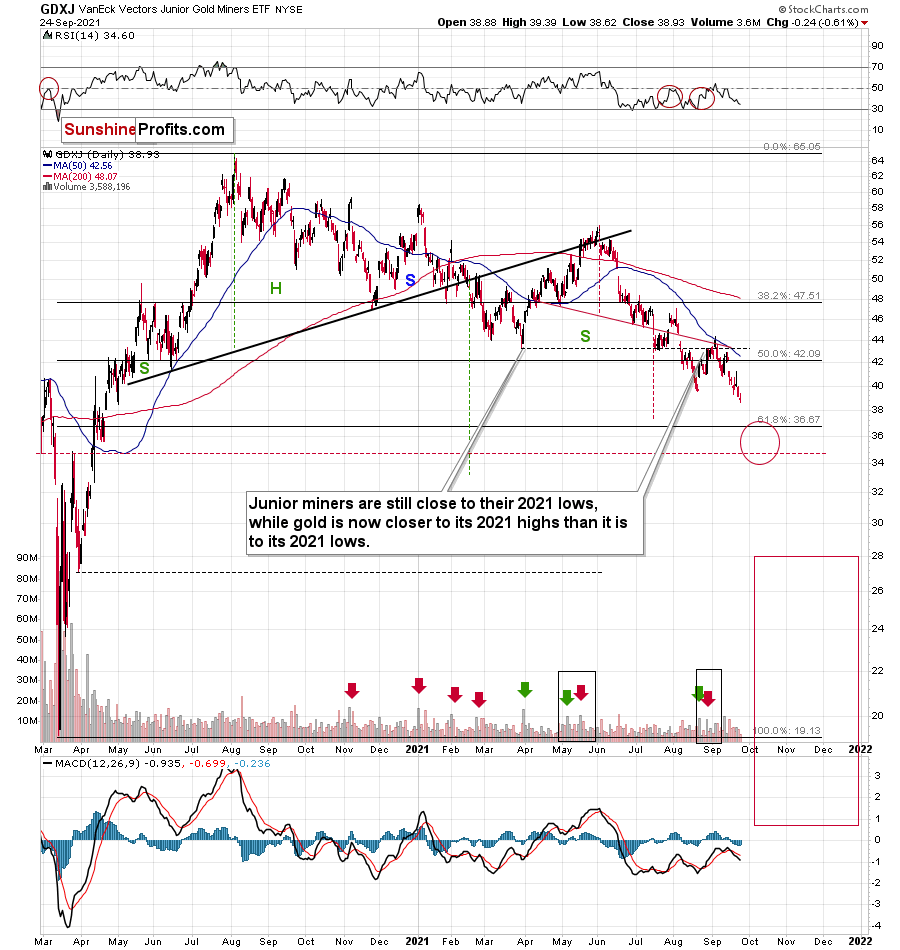
And while the GDX is likely to decline, so is its counterpart focused on junior mining stocks – the GDXJ ETF.
In the case of the GDXJ, the downside target is broader, as the 61.8% Fibonacci retracement, the late-March 2020 high, and the head-and-shoulders-based target are not so aligned.
A decline to the 61.8% Fibonacci retracement here would more or less correspond to the analogous move in the GDX in percentage terms. However, if the junior miners underperform (as they’ve been underperforming seniors for months), they could move even lower before rebounding.
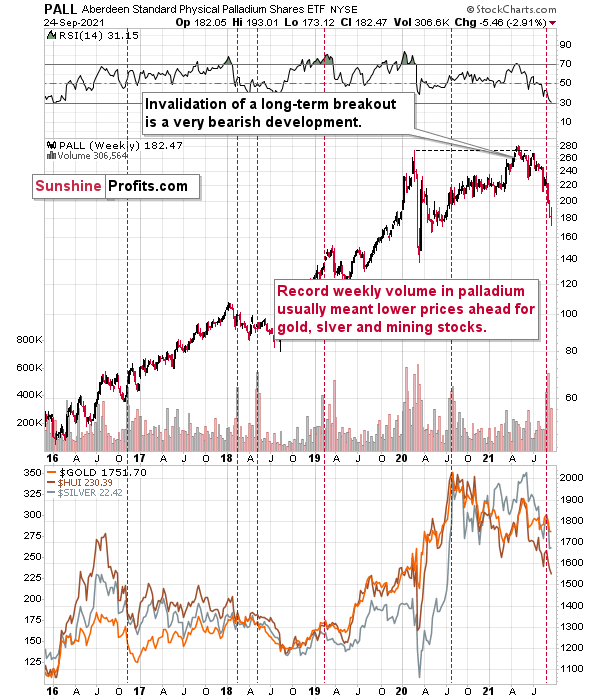
On a different note, let’s take a look at what’s happening in a less popular part of the precious metals sector – palladium.
On Sep. 7, I wrote the following:
Also adding credibility to the conclusions drawn from the volume spikes in the GDX ETF and the GDXJ ETF, last week, the Aberdeen Standard Physical Palladium Shares (PALL) ETF recorded a new 2021 high for weekly volume. And with abnormal volume offering a window into investor sentiment, historical euphoria preceded minor-to-massive declines in gold and silver (the red vertical dashed lines below). As a result, several areas of the precious metals market are sounding the alarm.
Last week’s volume spike was an anomaly, and whenever we see one on a given market, it’s useful to check what happened when we saw it previously. At times, you can notice some regularities – a pattern. And such a pattern could have important trading implications. That’s the case with palladium volume spikes, which – while rather inconsequential for palladium itself – were practically always followed by lower gold, silver, and mining stock prices. The implications for the said markets for the following weeks are thus bearish.
And indeed, the precious metals sector declined right after that volume spike. So far, the decline was only modest from the long-term point of view. Since some of the declines that followed the previous huge-volume signals from palladium were much bigger (especially the one following the 2020 top), we might see even lower prices of PMs and miners in the next weeks and months as well.
Disclaimer: All essays, research and information found on the Website represent the analyses and opinions of Mr. Radomski and Sunshine Profits' associates only. As such, it may prove wrong ...
more


