
Large-Cap Growth’s Been A Great Ride
If there’s one lesson that’s constantly reinforced year after year, it’s this: “Don’t fight the tape.” And this year, the tape reads “large-cap growth stocks” in bold-face type.
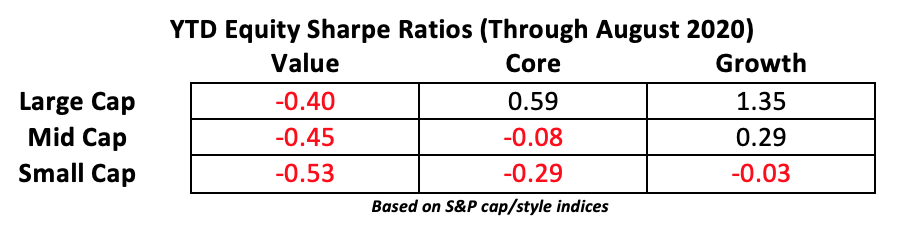
Maybe there’s no surprise in that, but if you look at the classic nine-box equity style matrix, you’ll see that two-thirds of the universe couldn’t put up a positive Sharpe ratio in 2020. Plainly, there hasn’t been much competition.
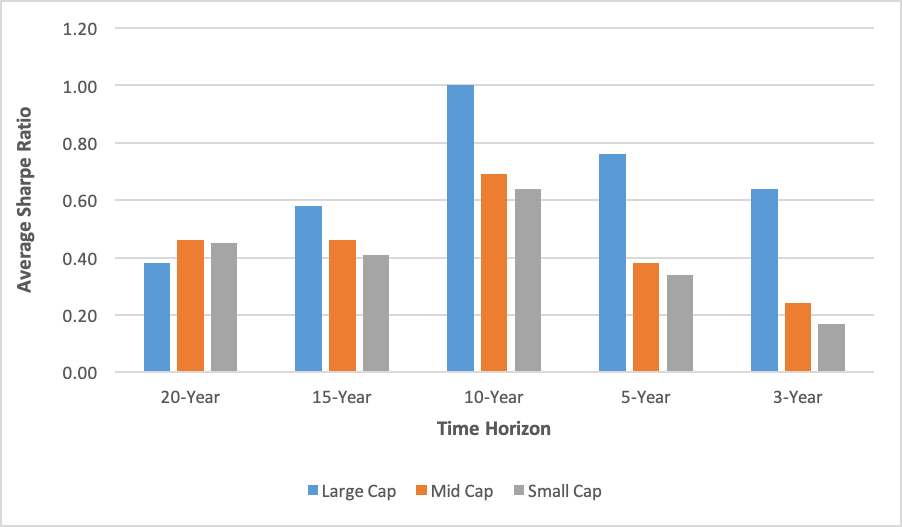
This year’s results are a capstone to a decade-and-a half of outperformance by large momentum-driven stocks. Twenty years ago, large-cap equity’s risk-adjusted returns lagged that of middle-tier stocks, but big stocks, heavily skewed toward technology and healthcare, have since taken the lead over four subsequent time frames.
Sharpe Ratios over Time (by Capitalization Tier)
Tech stocks have also driven a coincidental trend toward growth, helped in good measure by industrials and consumer cyclicals.
Sharpe Ratios over Time (by Style)
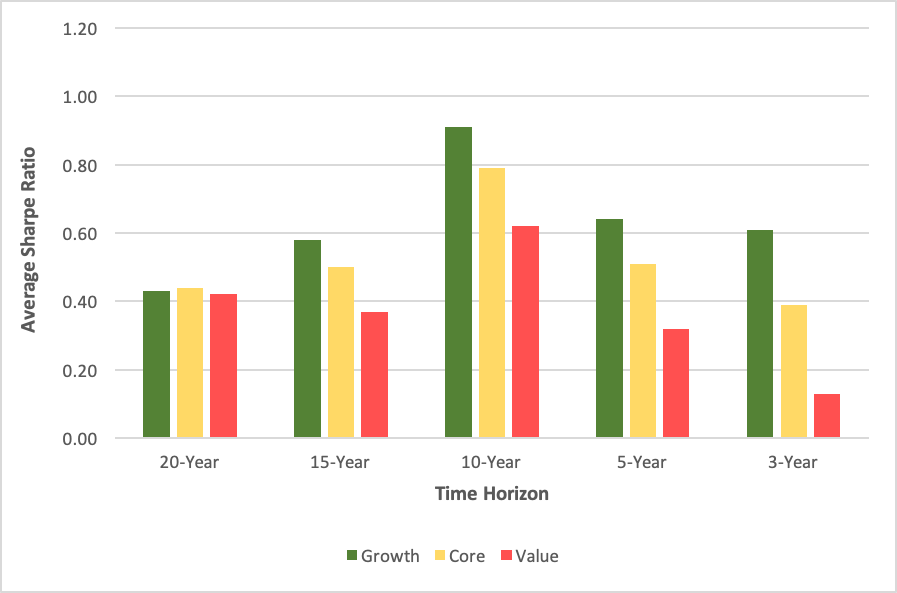
Notice something in these two histograms? The Sharpe ratios for the size and style factors peaked for the ten-year period ending August 2020. The reason? Well, think of how a Sharpe ratio is derived. It’s the quotient of an investment’s excess return divided by its volatility. Volatility’s spiked dramatically, albeit episodically, over the past decade. Not really a surprise.
But here’s something to consider. Large-cap growth may have maxed out. We take that view because of the factor’s pre-eminence in portfolios aiming to outdo the broad market, and a belief in mean reversion.
Nowadays, the equity portfolio that cranks out the highest information ratio (IR) consists of a single dollop of large-cap growth and nothing else. Keep in mind that the IR measures an investment’s excess return relative to a benchmark, such as the S&P 500, but also gauges that return’s consistency.
The optimum IR portfolio’s slate of exposures has been shrinking over time. Twenty years ago, the optimum IR portfolio comprised three cap/style factors. Five years ago, an investor could max out the IR with just two exposures. And three years ago, that objective could be reached with only one allocation.
The pivotal exposure in the optimized portfolios is large-cap growth. Twenty years ago, it owned 38% of the portfolio’s real estate, alongside large-cap core and mid-cap value. We can readily replicate the optimal portfolio with exchange traded index funds, starting with the iShares S&P 500 Growth ETF (IVW), the iShares S&P 500 ETF (IVV), and the iShares S&P Mid-Cap 400 Value ETF (IJJ), and trace its progression to the present in the chart below.
Equity Cap/Style ETF Portfolio Optimized for Maximum Information Ratio
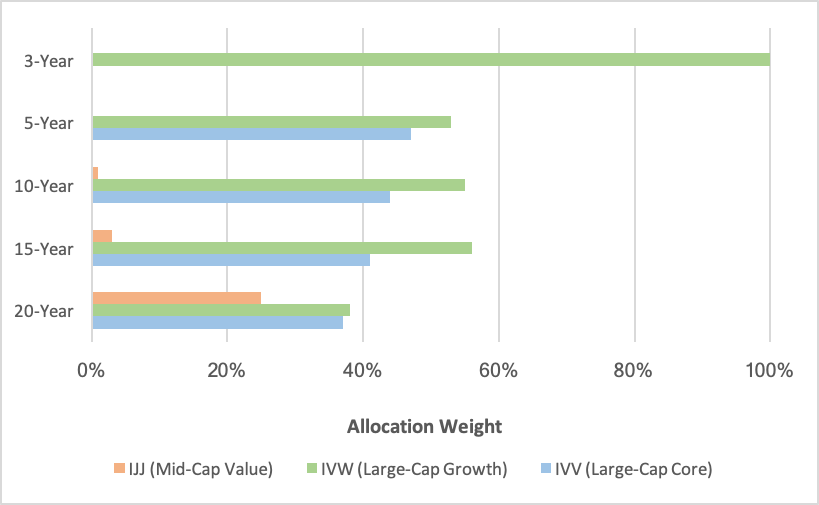
So, we’ve reached a singularity in our optimal portfolio, a condition that bespeaks significant risk concentration. Clearly, diversification across style and capitalization tiers has become a game of diminishing returns over the past two decades. Sooner or later, though, large-cap growth’s hegemony will be broken and its influence will return to more normative levels.
Why? Well, we now find ourselves in the thrall of the Federal Reserve which, through its chairman Jay Powell, recently announced a forward policy more tolerant of inflation. That alone is likely to spark a shift away from growth stocks. Growth likes deflation, not inflation.
Through Monte Carlo simulations, we can see the impact that this shift might have on our IR-optimized portfolios. Using long-term returns and correlations, we can compare the 20-year portfolio to its present-day iteration, looking for return probabilities years into the future. With 10,000 replications, we’ve found the three-asset portfolio is likely to outdo the current singleton in the future.
The optimized mix for the 20-year period ending August 2020 tilts toward bigger stocks, but offers diverse style shadings. Historically, the portfolio’s average annual return is 7.22% with a standard deviation of 16.52%. The current optimal portfolio—devoted solely to large-cap growth—earns an average annual return of 6.59% with 17.69% volatility.
Modeling five years forward, the one-asset portfolio produces a 5.22% annual return at the fiftieth percentile. At the tenth percentile, the portfolio earns -4.45% annually; at the ninetieth percentile, 15.55%. Over the five-year horizon, the maximum drawdown is forecast at -25.11%.
The three-asset portfolio, however, earns 6.02% annually at the fiftieth percentile, the midpoint of a range featuring returns of -2.62% at the tenth percentile, and 15.64% at the ninetieth. The predicted maximum drawdown is -22.54%.
Our simulations seem to confirm a peak in the influence of large-cap growth in a market-beating portfolio. Put another way, a case seems to be made for more diverse asset mixes. Of course, these conclusions come with caveats.
Most important is the recognition that a Monte Carlo simulation is a mathematical technique that yields a range of outcomes and probabilities. It’s not a guarantee of investment results. Modeling relies on a range of historical returns data over a specified time horizon. Black Swan events, e.g. out-of-range returns, could significantly skew the model’s results.
Still, the mathematical discipline of the simulations gives us a sense of mean reversion in action. It puts numbers to it. Specifically, it tells us that large-cap growth’s days may be numbered.
Disclosure: None.


