

Image Source: Unsplash
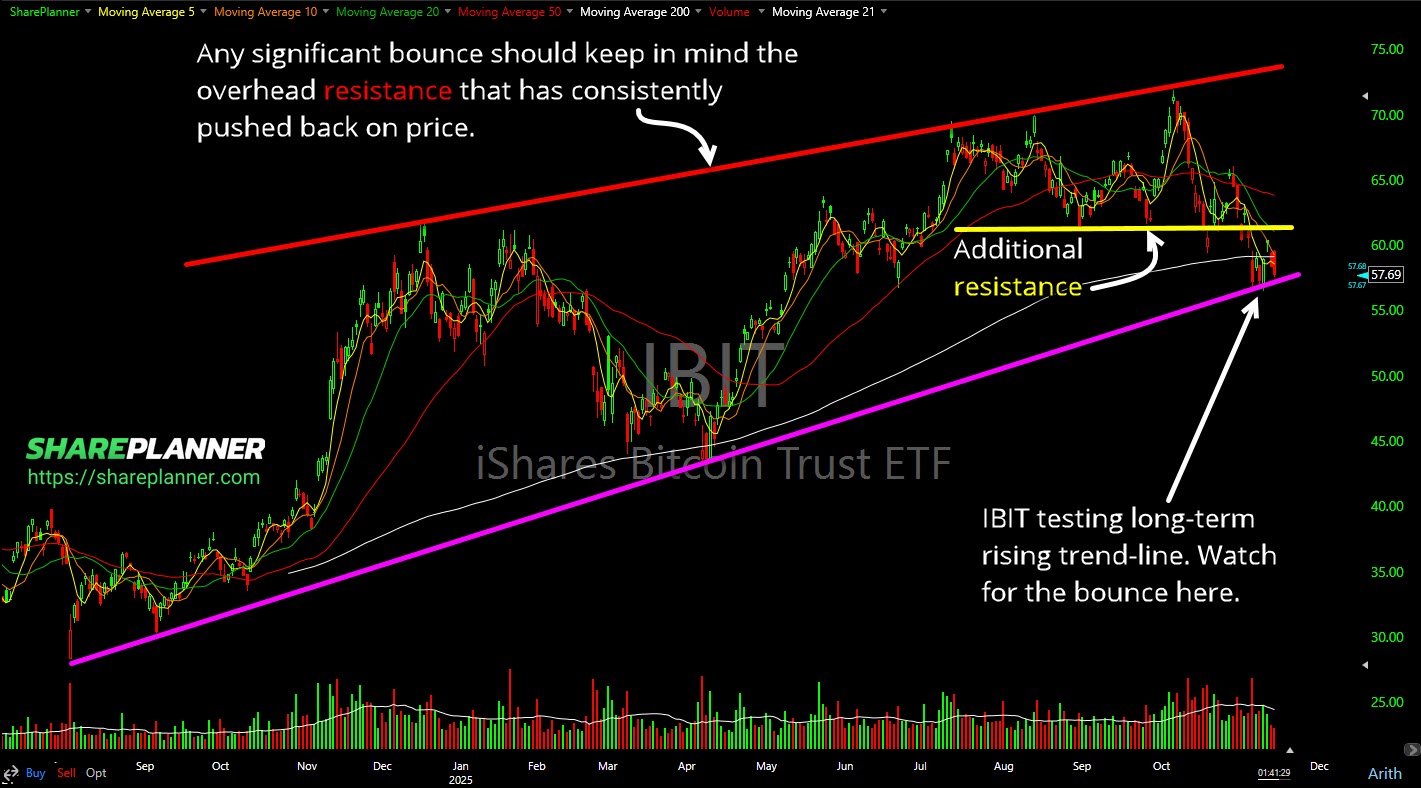
The Bitcoin ETF (IBIT), has had a tremendous run since its inception, but lately, it has started to show some signs of weakness. After hitting a high of $71.82, the stock has pulled back and is now trading around the $57/share mark. This pullback is significant, and it’s happening at a critical technical juncture that could have major implications for IBIT (and Bitcoin).
Let’s break down what the chart is telling us.
(Click on image to enlarge)
The Battle at Support for IBIT
Right now, IBIT is in a precarious position. It’s testing its rising trendline, which has provided support for the stock during its uptrend. A break below this trendline would be a bearish signal, suggesting that the upward momentum is fading.
At the same time, the stock is fighting to hold its 200-day moving average. For traders, the 200-day moving average is a key long-term indicator. It managed to hold it on the only other time it has been tested back in April of this year, and while it wasn’t a perfect test, it didultimately hold. So holding this moving average would also be seen as a bullish gesture, while a sustained break below it is often a sign of a major trend change to the downside. The fact that both of these crucial support levels are being tested simultaneously makes this a critical moment for IBIT.
Potential Paths Forward
If IBIT manages to hold support here and bounce, the next challenge will be overhead resistance. A successful bounce would need to lead to a “higher high,” meaning it would have to eventually surpass the previous peak of $71.82 to confirm that the uptrend is still intact.
However, before we even get to that point, there’s a more immediate resistance level to watch. A resistance zone formed just above $61 (the yellow line on the chart). If IBIT rallies to this level but fails to break through, it would create a lower high. This price action would strongly suggest that a top is forming for IBIT, and by extension, for Bitcoin. A failure at this level would likely signal that the bears are taking control.
My Take on IBIT
Given the current setup, I’m watching these levels very closely. The confluence of the rising trendline and the 200-day moving average makes this a make-or-break spot. While a bounce is possible, the resistance at the $61 level presents a formidable obstacle.
For traders, don’t trade this and suddenly become complacent. Be vigilant, plan your trade and manage risk, and above all, don’t become a bagholder if the trade doesn’t go your way! A decisive break below the current support could open the door to a much deeper correction. Conversely, a strong bounce that reclaims key levels would be encouraging for the bulls. The price action in the coming days will be telling and could set the tone for the broader crypto market.
More By This Author:
Is It Time To Buy The Dip On Oracle?ORCL Bounce?
Using Top-Down Analysis For JNJ Trade Setup


Comments
Log in or sign up to join the conversation.