How Did Gold Miners Provide An Intraday Setup Last Week?
Image Source: Unsplash
Here, we will look at the past performance of the GDX ETF by referring to its hourly charts throughout the past week.
The rally from the March 9 low unfolded as five waves, which created a bullish sequence in our system. Therefore, we knew that the structure was incomplete to the upside, and we believed it would see more strength in three, seven, or eleven swings against the March 6 low. So, we advised members to buy the dips during such swings.
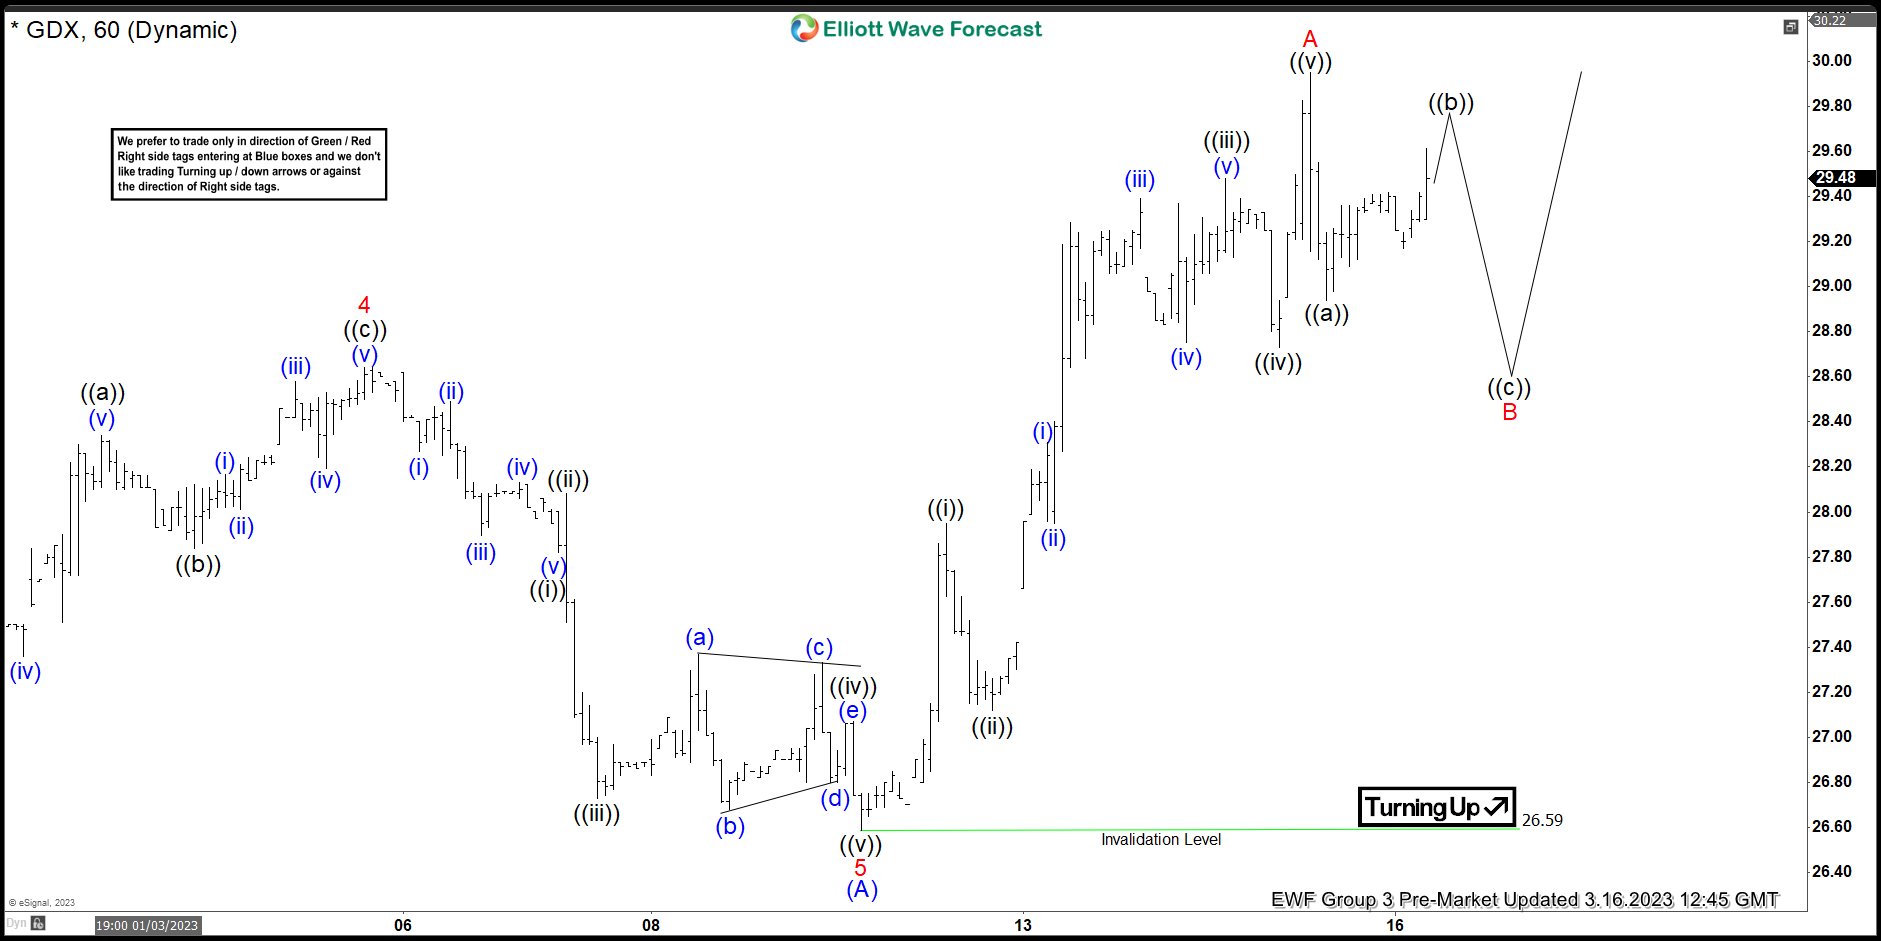
GDX ETF One-Hour Pre-Market Chart for March 16, 2023
Here is the one-hour chart from March 16. We believed the decline of point ((b)) would see buyers after point B (illustrated in red) was reached, producing three swings.
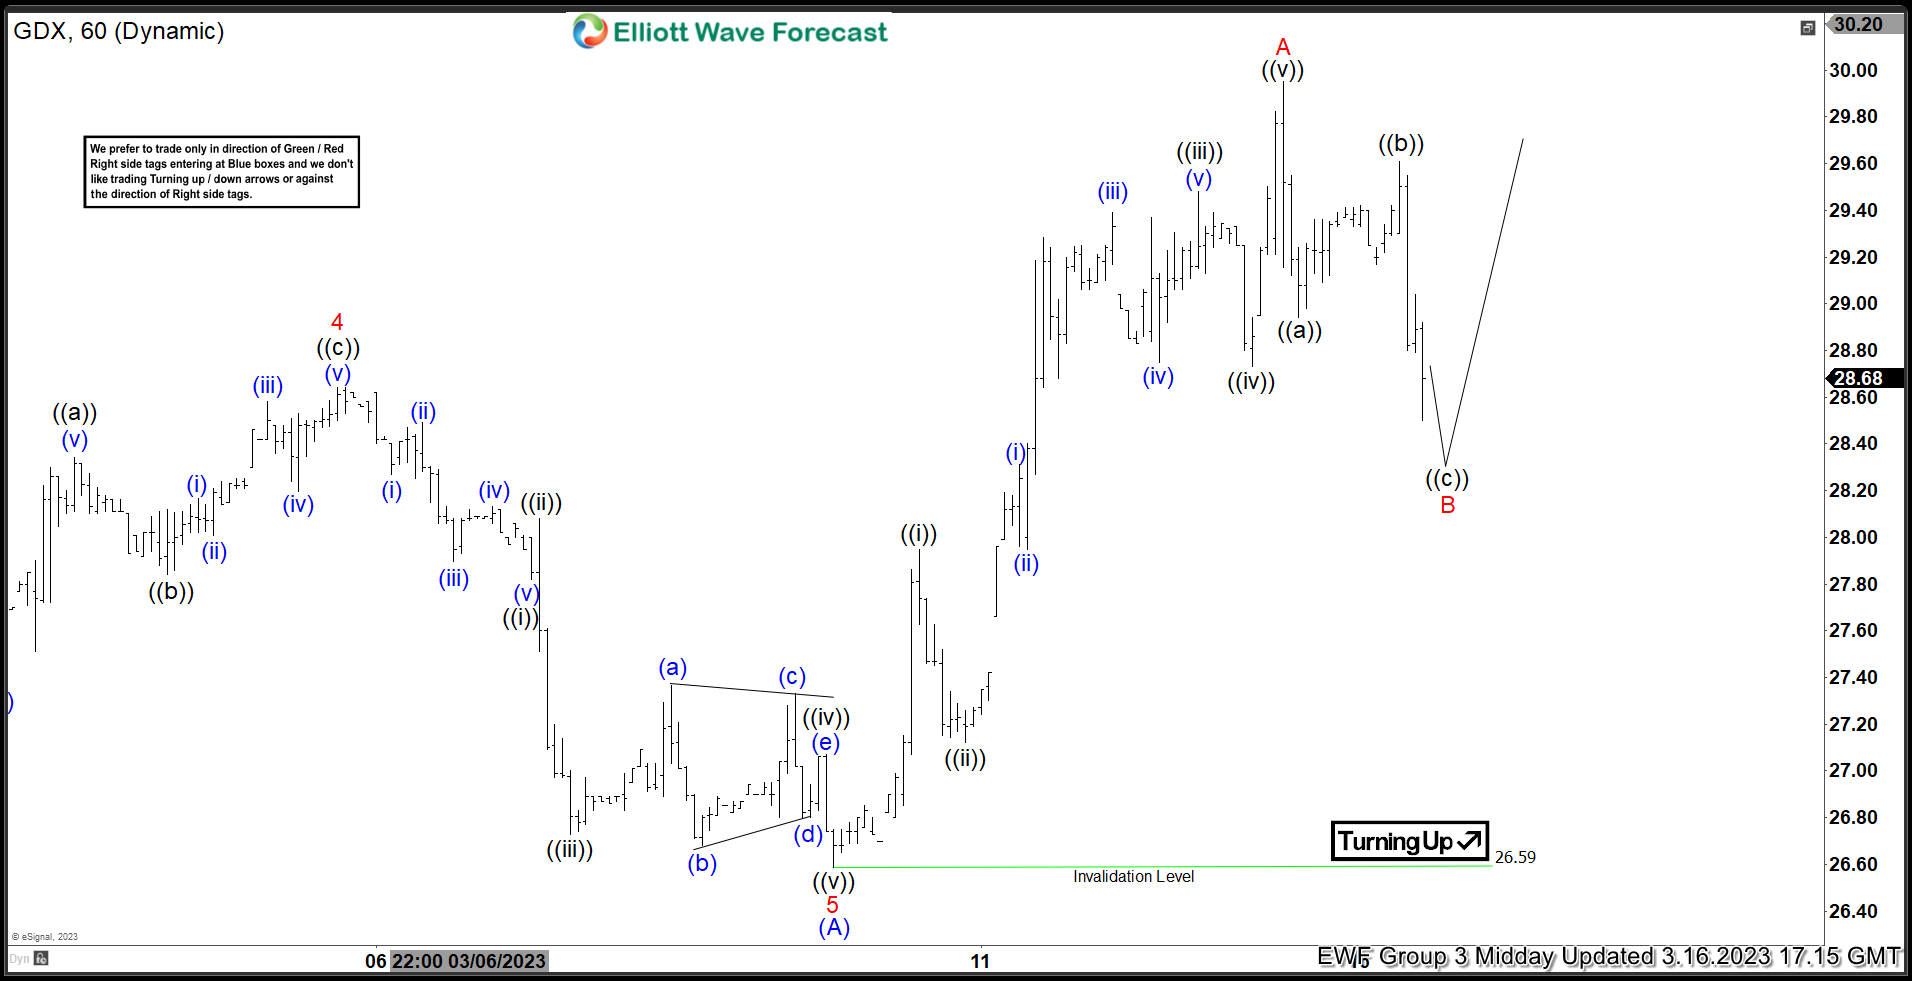
GDX ETF One-Hour Mid-Day Chart for March 16, 2023
Around mid-day, the ETF was seen trading within the area we discussed, and we signaled for readers to enter the trade at market price.
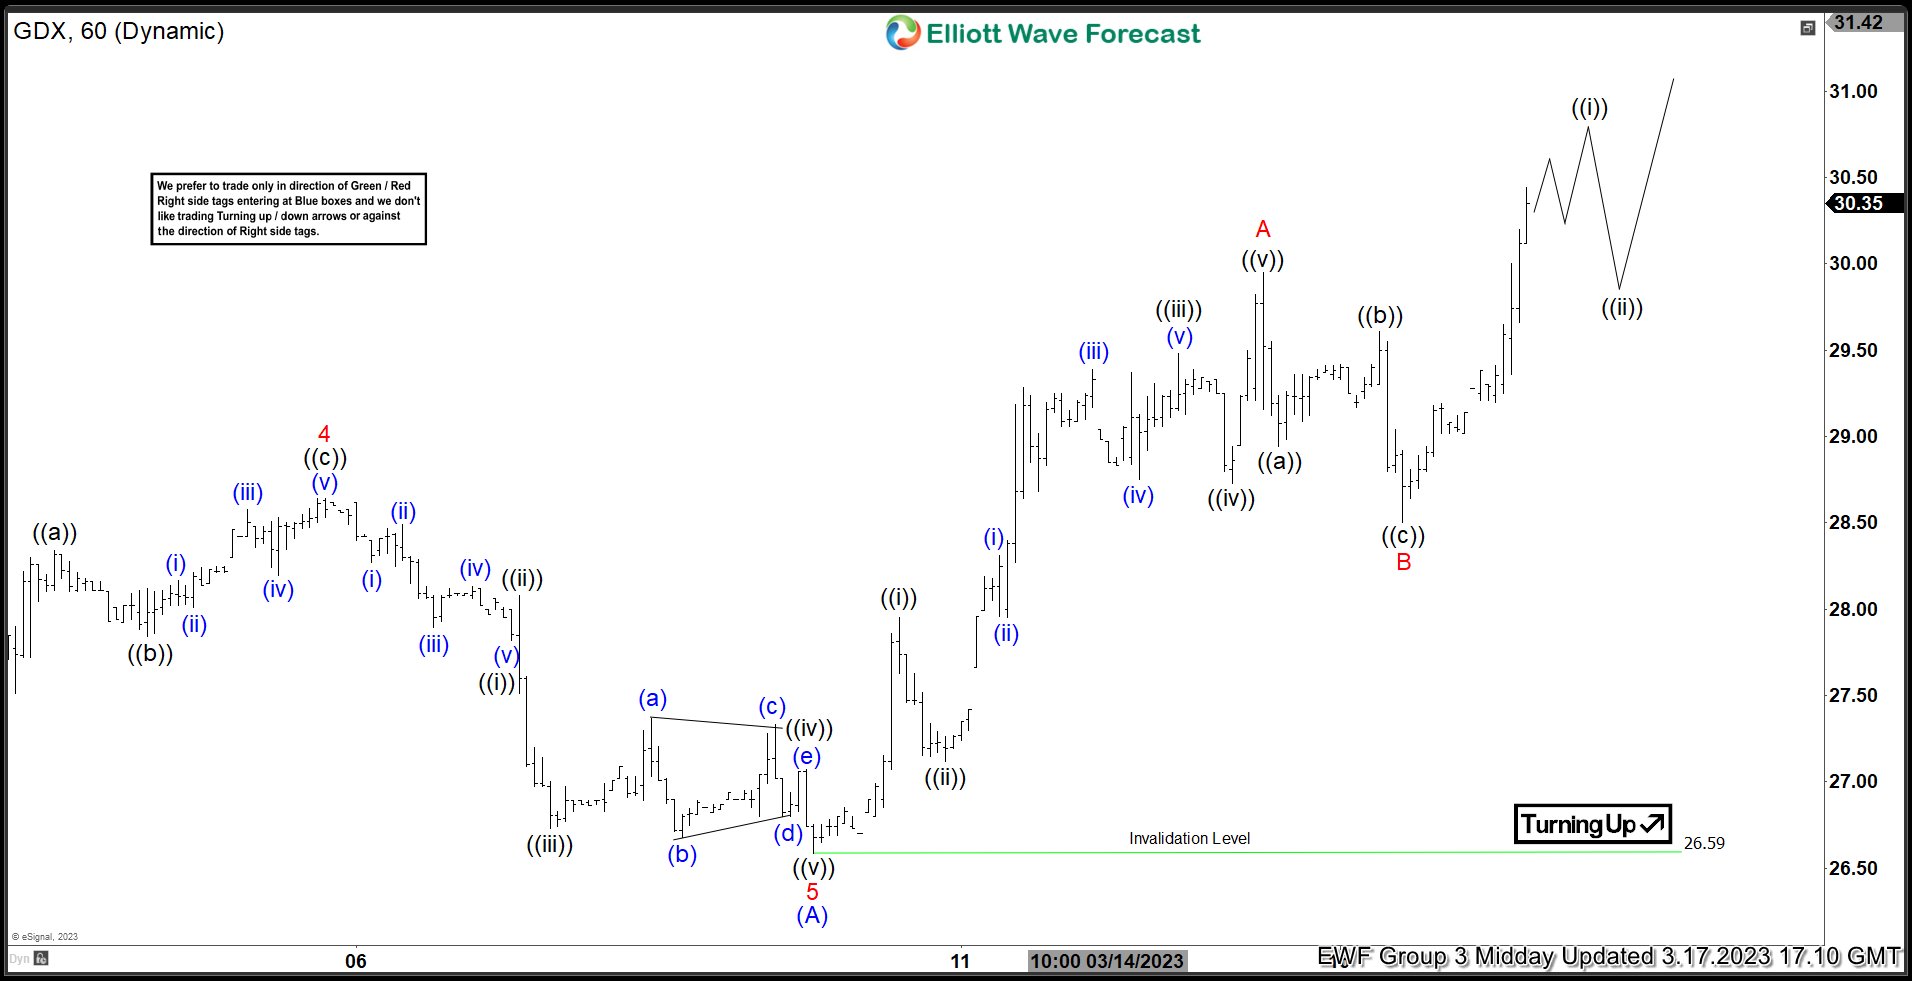
GDX ETF One-Hour Chart for March 17, 2023
Here is the one-hour chart from March 17, which illustrates how the move took place as expected. Within the course of 24 hours, the ETF moved higher after the three-swing pullback, breaking above the previous peak seen at point A (illustrated in red). This has remained a relatively risk-free position. We will likely remain long of this position, as we set our sights toward the area at $31.80.
More By This Author:
ETFs vs. Mutual Funds: Which Is Better for Investors?
FCX : Favors Upside & Should Remain Supported
American Airlines Found Buyers At The Blue Box Area
Disclaimer: Futures, options, and over the counter foreign exchange products may involve substantial risk and may not be suitable for all investors. Leverage can work against you as well as for ...
more


