
2021 has shown a striking similarity to 2011, as it has been another sideways, range-bound market. Both of these years were coming off of big winning years after major corrections. In 2011, the market was coming off of two strong years in 2009 and 2010 following the 2008 financial panic bear market. In 2021, the market was coming off of the exceptionally strong 2020 market that followed the coronavirus panic.
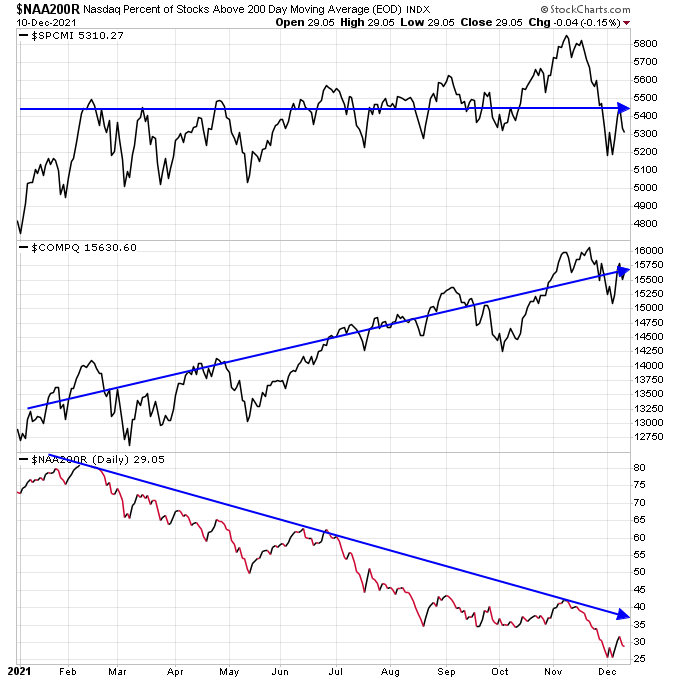
Deteriorating breadth was a major contributor to both of these weak markets. As shown in the charts below, the percentage of stocks above the 200-day moving average (bottom of the chart) in the Nasdaq declined throughout the year.
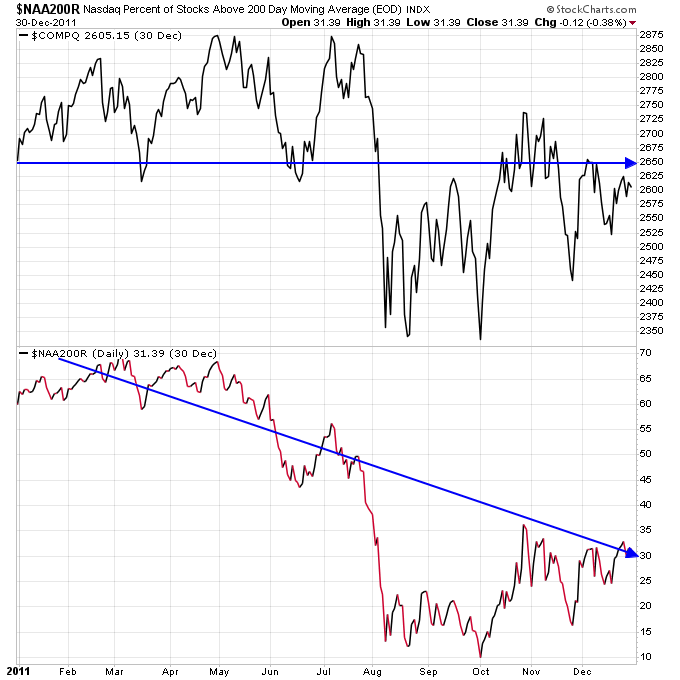
The difference in 2021 vs. 2011 is that larger-cap stocks were able to hold up the major indexes, as shown in the second chart where the Nasdaq in 2021 is higher on the year vs. going sideways in 2011.
But if you look at the S&P 500 Completion Index SPCMI, which excludes the top 500 stocks from the index, you may see it has gone sideways in 2021 just like the overall market in 2011. So, excluding the effect of the largest stocks, there’s simply been choppy action in the stock market.
In a sideways overall stock market, the best stocks can rally, but the pressure of the overall market stunts their growth. And the worst stocks don’t have the support of the overall market at their back, so they can fall dramatically. Stan Weinstein emphasizes that the probabilities of success are lower when the overall market isn’t a tailwind.
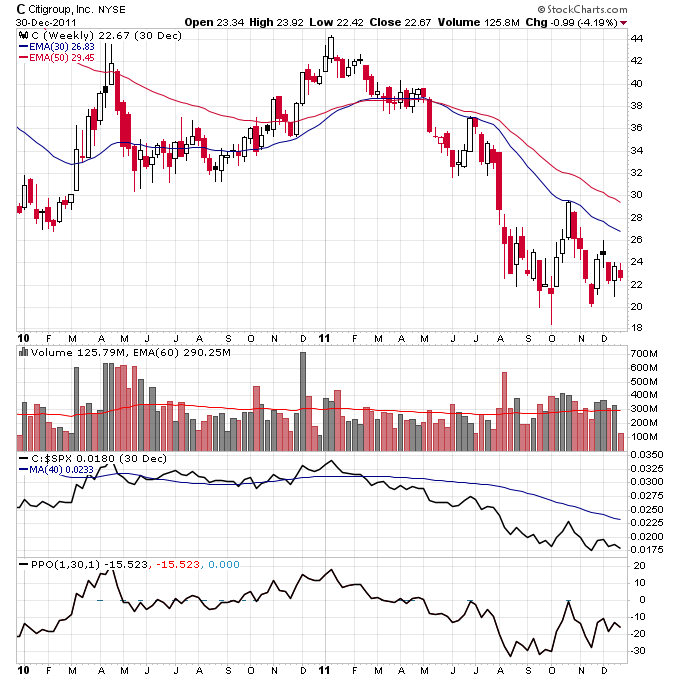
An example of a weak overall market wreaking havoc was seen with the bank stocks which rallied after the financial panic but had big Stage 4 declines in 2011.
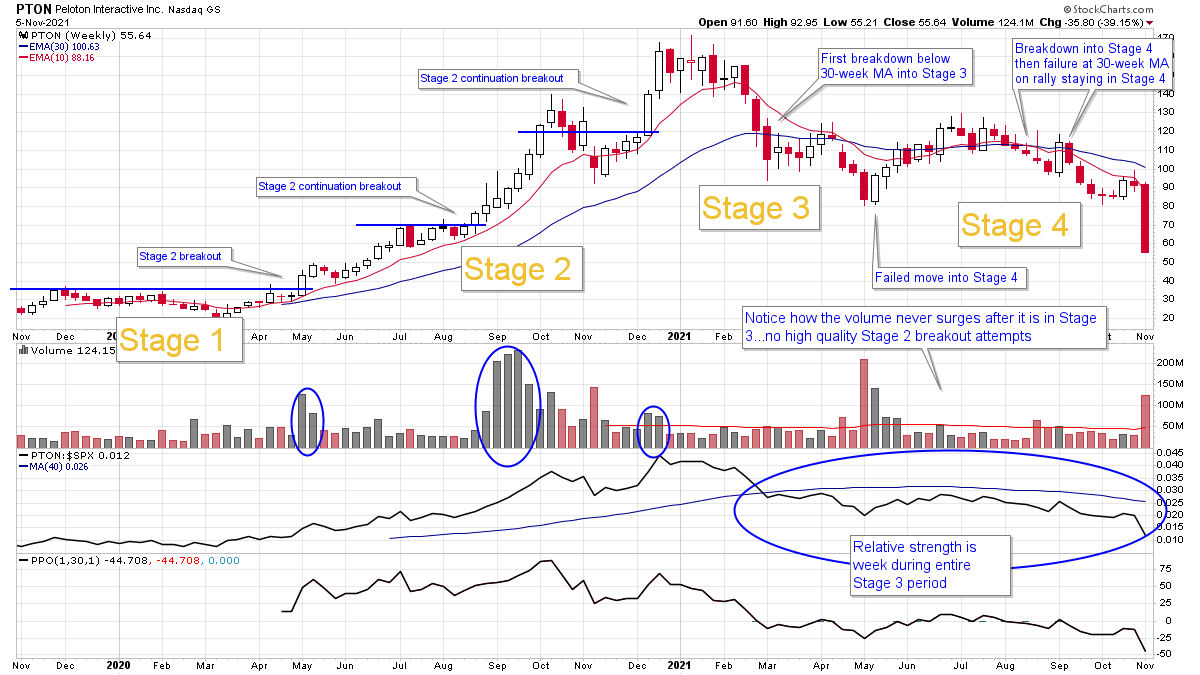
In 2021, many growth stocks that were big winners in 2020 have moved from Stage 3 into Stage 4 and have been hit hard. Peloton (PTON) was a stock I did a lengthy analysis of on Twitter, and it rolled over into Stage 4 this year and experienced a big decline.
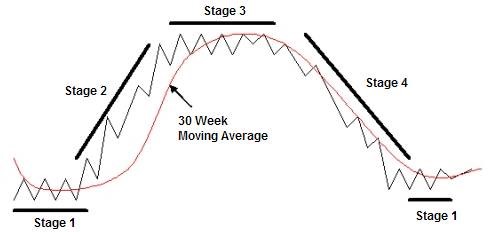
When the market is in a sideways, range-bound market after a Stage 2 rally, this is known as Stage 3, wherein the market digests the previous rally and sets up its next move. From Stage 3, the market can either break back into Stage 2 or breakdown and move into a Stage 4 decline. In 2011, the market broke out into Stage 2.
One of the best things to do during a tough market is to study relative strength. The best acting groups and stocks in those groups during a correction tend to lead the market higher once the correction is over. Since sideways Stage 3 markets can last for multiple months, you can look for groups and stocks in those groups that outperform the S&P 500 during the same time period.
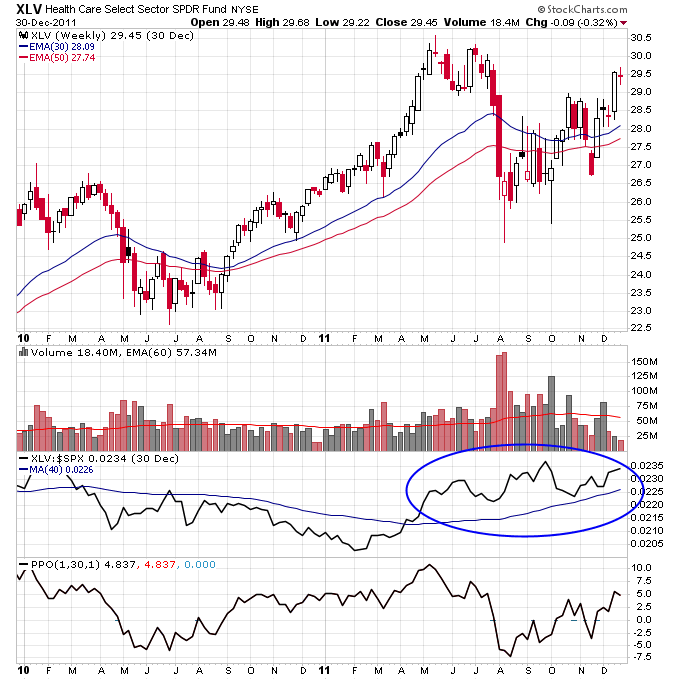
One group that showed a lot of relative strength against the S&P 500 in 2011 was healthcare. Shown below is XLV, which outperformed the S&P 500 during all of 2011 from May onward (see circled area in chart). Notice how XLV tried to breakout in May 2011, but the pressure from the general market stalled this breakout and it moved back down. This early sign of strength was simply put on hold while the correction in the market needed time to play out.
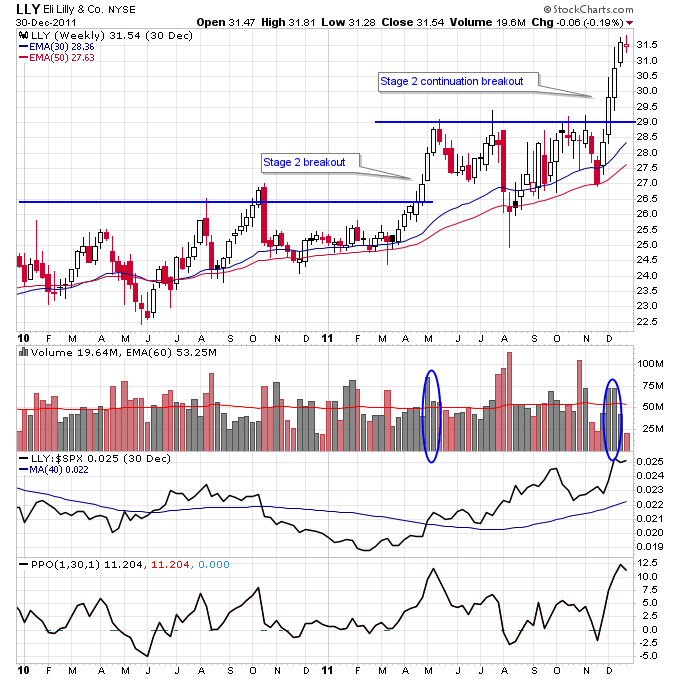
Once the pressure on the general market lifted, one of the leading stocks in the healthcare group was LLY, which completed a Stage 2 continuation breakout in December 2011. This stock showed early strength, but then it consolidated sideways for multiple months after the breakout due to pressure from the overall market. Once this pressure was lifted, this stock started to takeoff to the upside.
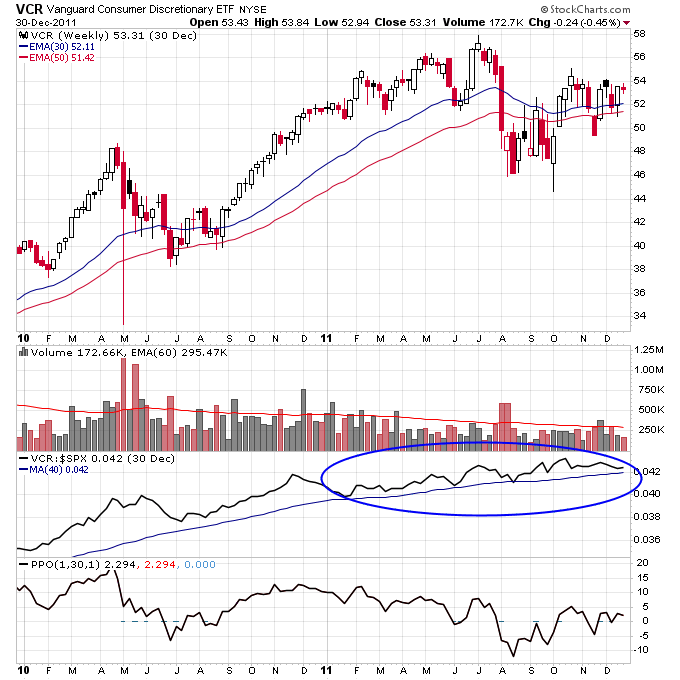
Consumer discretionary also showed tremendous relative strength in 2011, as shown by the chart of VCR below (relative strength noted in the blue circle).
VAC was a big winning stock in 2012. As shown in the next chart, it broke out of an IPO base in early 2012 and made a monster Stage 2 advance.
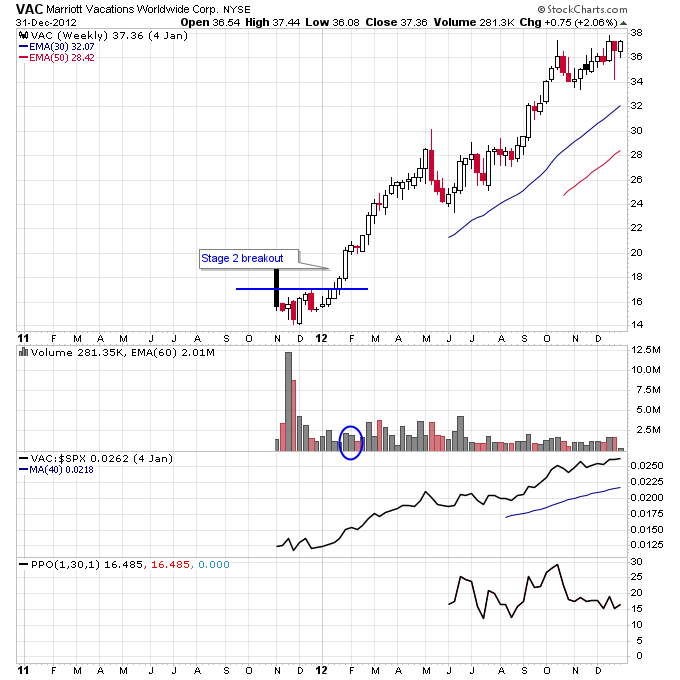
Since VAC was a new IPO it had no resistance to fight through on the move higher, unlike other stocks who were pushed lower during the sideways 2011 market. This is another reason its important to keep track of new merchandise that hits the market because these stocks can emerge from IPO bases with no resistance. Limited or no resistance on a breakout is one of the attributes of a high quality Stage 2 breakout.
In December 2021, the market is still working through this corrective market, but multiple groups have started exhibiting relative strength against the rest of the market and a number of high quality Stage 2 breakouts have occurred recently.
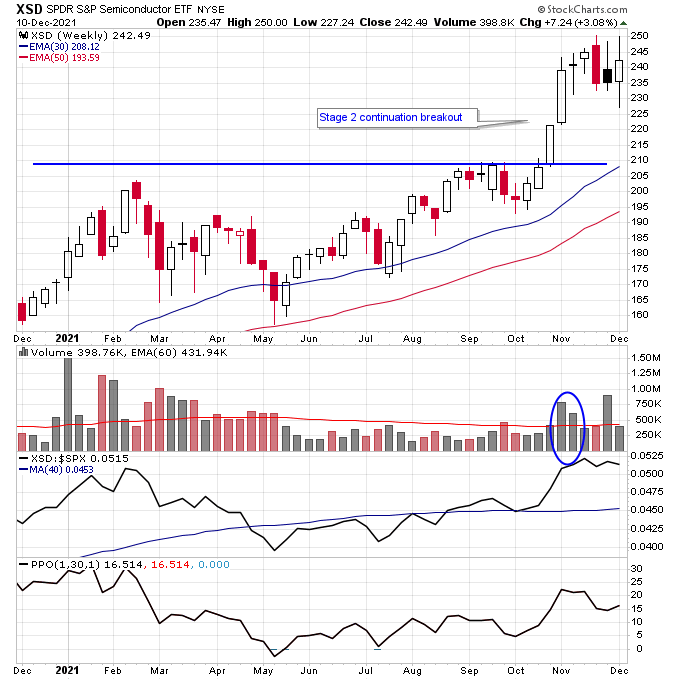
XSD, as shown below, is a semiconductor ETF that completed a Stage 2 continuation breakout in early November and has consolidated nicely under downward pressure from the market in early December.
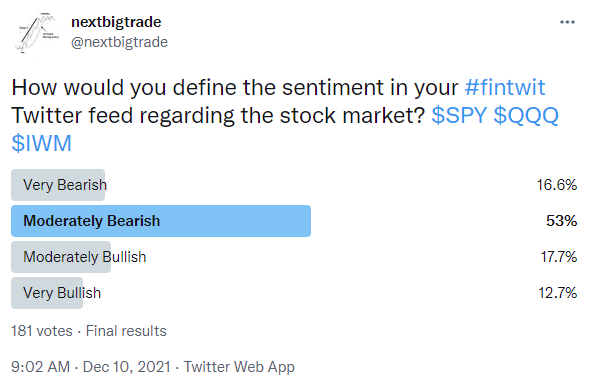
Other groups exhibiting relative strength include homebuilders (ITB) and oil and gas stocks (XLE). Sentiment also appears to be poor (which isn’t surprising given the amount of carnage in many stocks). A recent survey I ran had 70% of respondents describe the sentiment on their own Twitter feeds as very or moderately bearish.

Comments
Log in or sign up to join the conversation.