Health Care Select Sector XLV Found Buyers At The Blue Box Area As Expected

Image Source: Pixabay
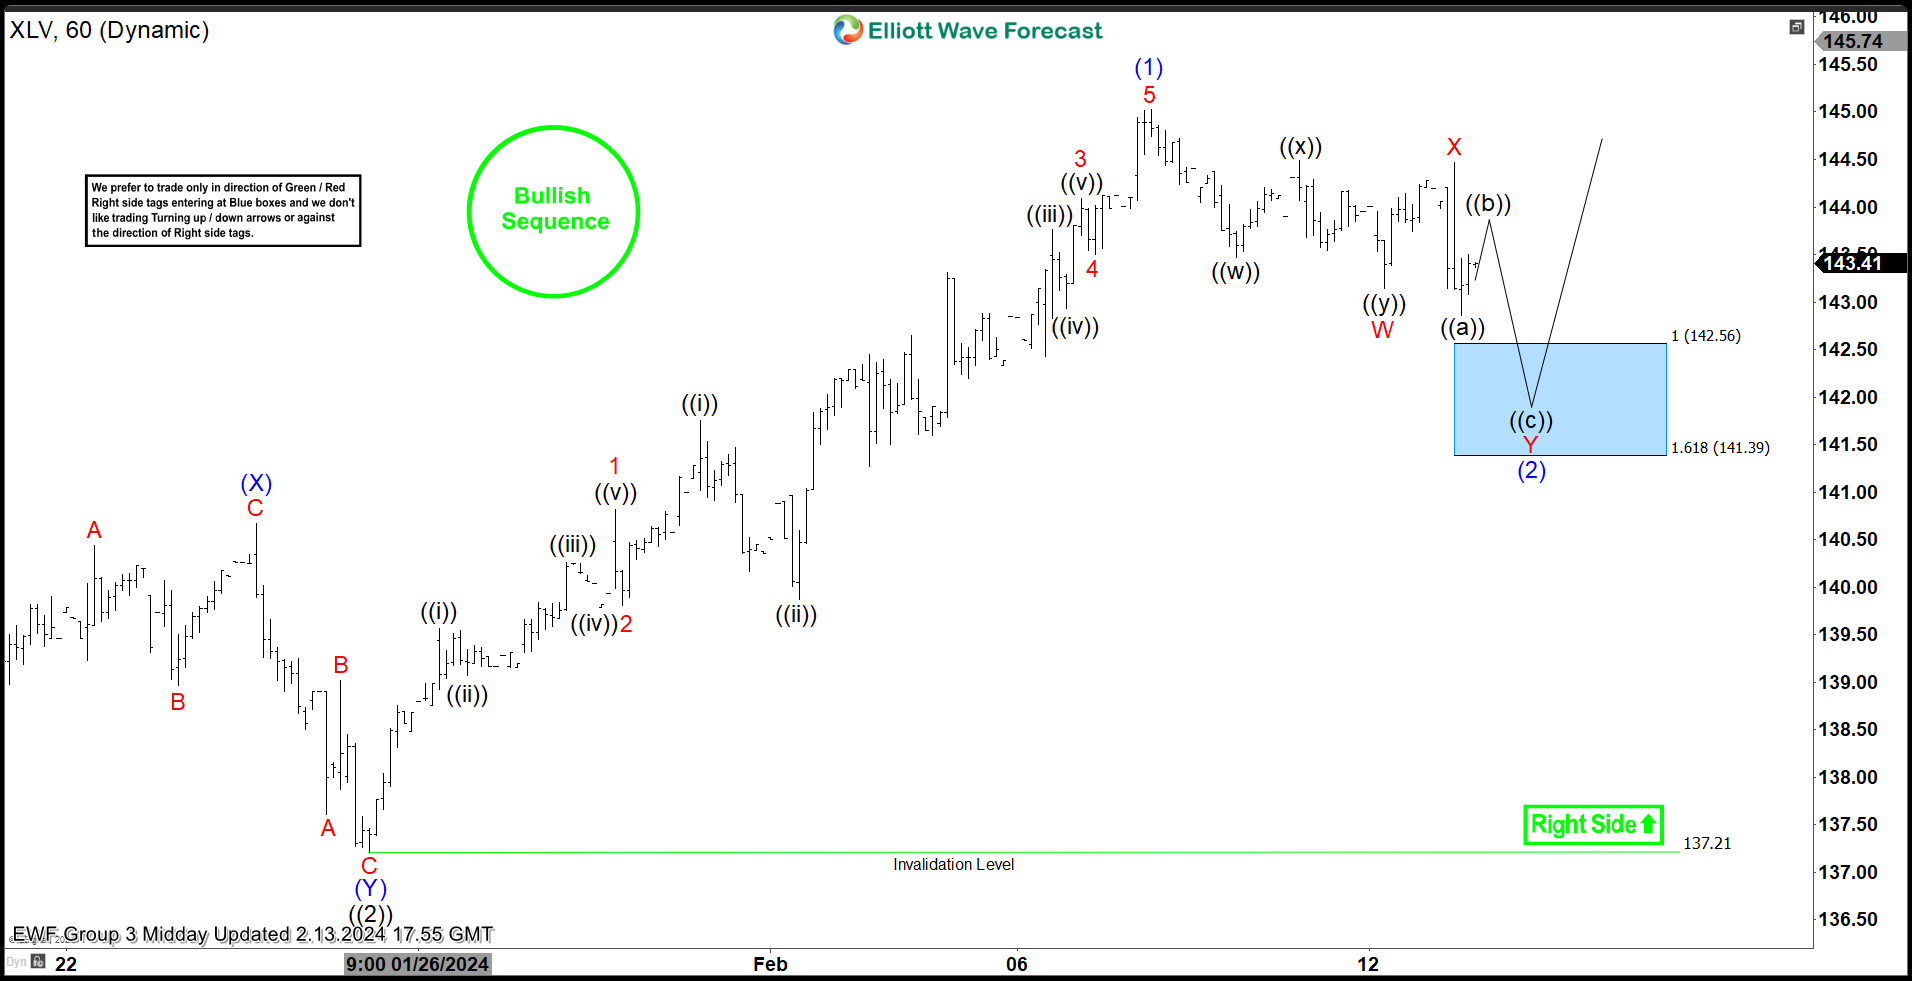
In today’s article, we will look at the past performance of the one-hour chart for the Health Care Select Sector ETF XLV. The rally from the Jan. 25 low at $137.21 unfolded as a 5-wave impulse. So, we expected the pullback to unfold in 7 swings and to find buyers again.
XLV One-Hour Chart: Feb. 13, 2024
(Click on image to enlarge)
Here is the one-hour chart from Feb. 13, 2024. We expected the pullback to find buyers at the blue box area within the 142.56-141.39 range in a 7-swing structure (WXY).
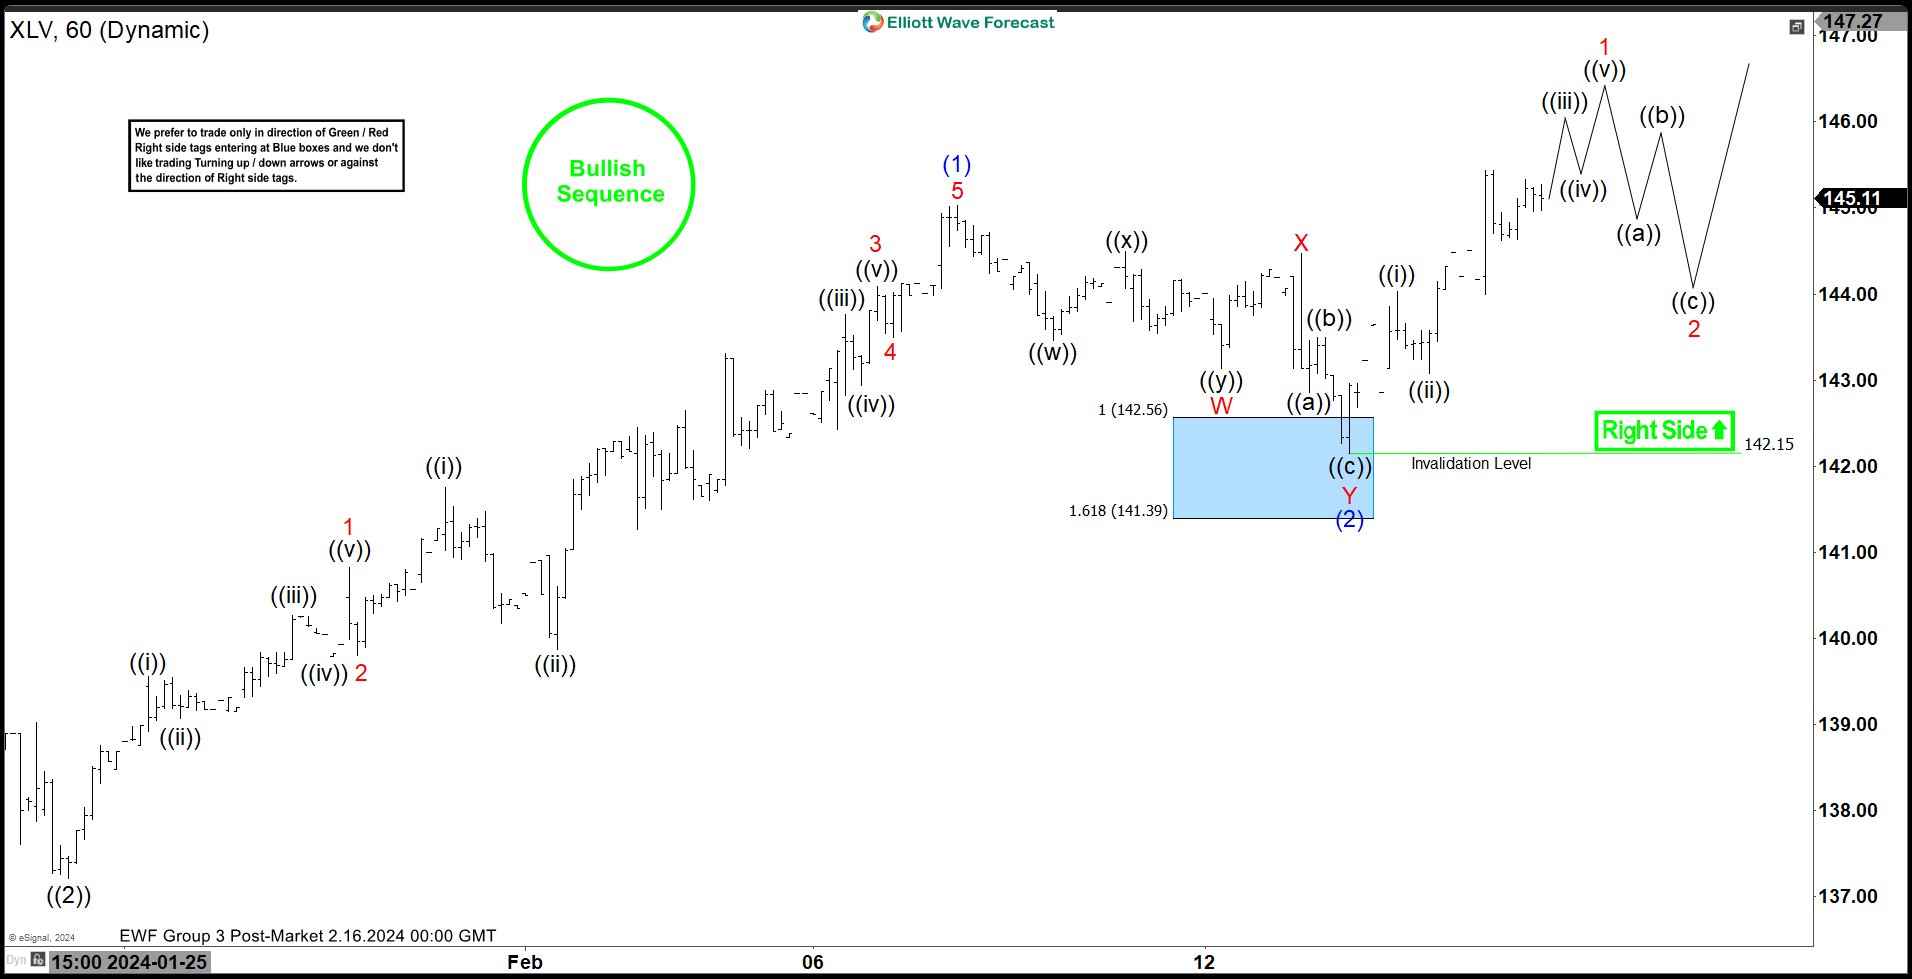
XLV One-Hour Chart: Feb. 16, 2024
(Click on image to enlarge)
Here is the one-hour chart update from a few days later on Feb. 16, 2024. The chart shows the bounce taking place as expected. The ETF reacted higher from the blue box after demonstrating a double three correction, allowing longs to get a risk-free position. The ETF is expected to remain supported towards the $156-168 range before another pullback can happen.
More By This Author:
EURJPY Pullback Should Find Support For Further UpsideGold May See Larger Degree Correction
Apple Should See Further Downside
Disclaimer: Futures, options, and over the counter foreign exchange products may involve substantial risk and may not be suitable for all investors. Leverage can work against you as well as for ...
more


