

Image Source: iStockPhoto
Have option-selling strategies suppressed implied volatility? The answer to this question is, unequivocally, "yes." We would prefer, however, to call it a structural dislocation rather than suppression.
There will always be an ebb and flow, over various time frames, to the magnitude. But the fact of the matter is end-users, by way of option selling funds, aren’t intentionally contributing to “suppression,” but they are intentionally buying into marketing spin and managers concerned with product and AUM growth for the cause. Therefore, the strategies are contributing to this large structural dislocation and have been doing so increasingly en masse since post-GFC.
The oversupply of option-selling strategies has changed the game. Previously, these strategies were marketed as defensive equity, but more recently have picked up a new marketing spin: derivative income. These product-based price-insensitive strategies have a material effect on the implied volatility of options, specifically for S&P 500 options and, therefore, the pricing of those options.
Unlike an equity valuation, in derivatives markets, you can simply look at the price. This is manufacturing instrument risk for end users looking to achieve various goal-based, product-based exposure. For us, this presents a tremendous opportunity on the other side, seeking value.
If you run a backtest on a long historical time period where the relevant market was small and the relevant strategy had no material institutional capital, you will get a very different answer than the go-forward answer when institutional capital shows up.
The First Wave
The first large wave of option selling and hedged equity investor interest hit the marketplace post-Global Financial Crisis (“GFC”). Those managers already in the space were rewarded and offered historically attractive-looking strategies. As both retail and institutional investors were looking for lower volatility equity solutions, their popularity grew.
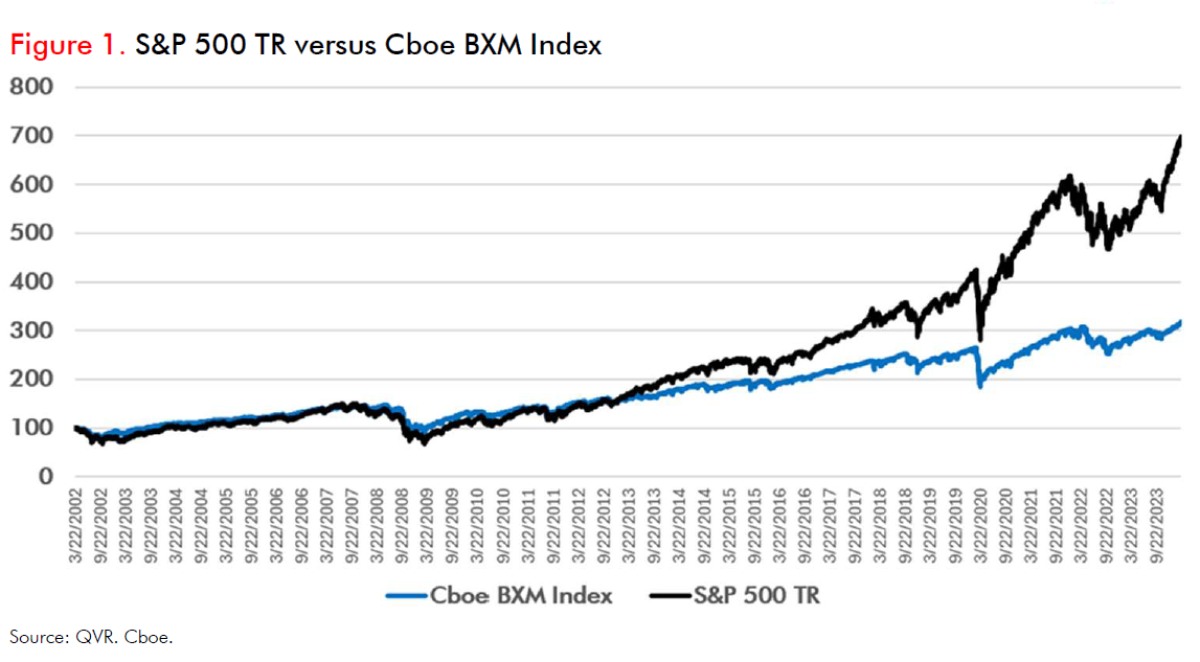
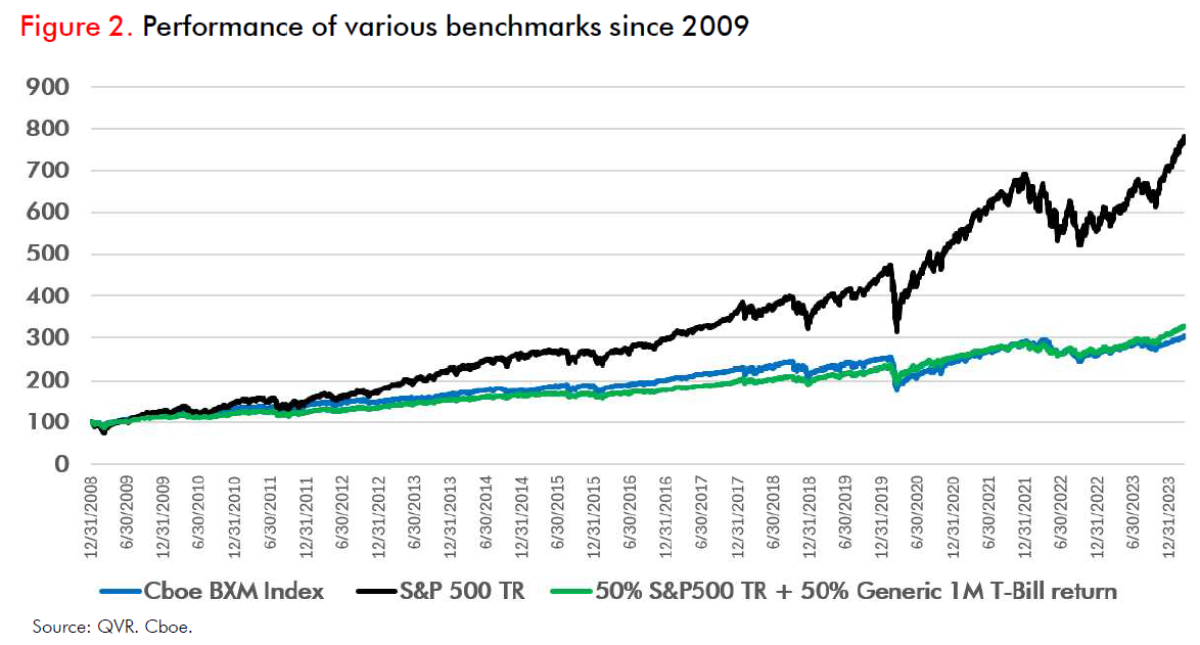
That attractiveness quickly deteriorated. Figure 1 shows the S&P 500 total return performance relative to Cboe BXM (S&P 500 BuyWrite Index) since inception of BXM data. Figure 2 shows performance since 2009.
(Click on image to enlarge)
(Click on image to enlarge)
The Second Wave
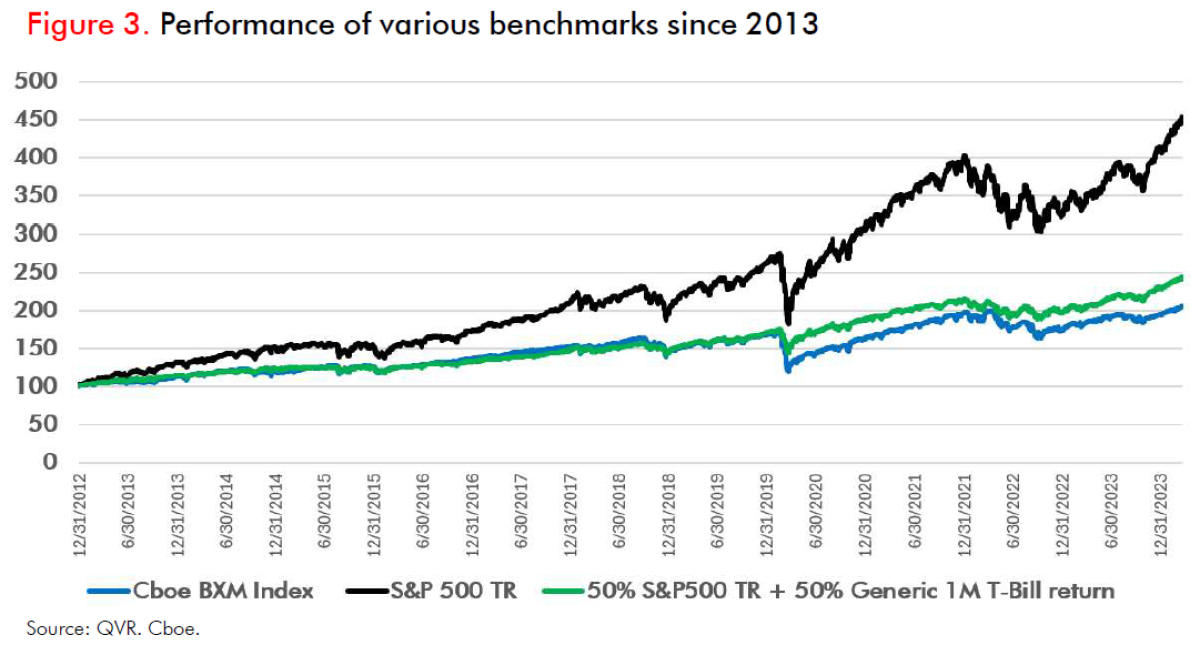
The second large wave of option selling and hedged equity strategies hit the marketplace around 2013, with a large number of public funds hitting the market. One of the largest well-known products was launched during this period. Since post-GFC and especially with 2013 as a starting point, an investor would have been better off in a strategy mix of the risky (S&P 500 Total Return) and risk-free assets (U.S. T-Bills).
Not to mention avoiding the fees associated with option-selling strategies. Investing in a 50% S&P 500 total return index portfolio and investing the remaining in U.S. T-Bills would have outperformed to date versus buying into a benchmarked strategy such as the Cboe BXM Index. See Figure 2 and Figure 3.
For the 50/50 strategy, it is effectively half the downside risk with better returns. For the Cboe BXM Index, the downside cushion is the call premium.
(Click on image to enlarge)
The statement of, “selling options should generally have a positive return over time” does not equate to “one should sell options.” An investor should always think about the portfolio context and the opportunity cost of capital. Also, one should consider up-down capture, which we already addressed in a recent research piece.
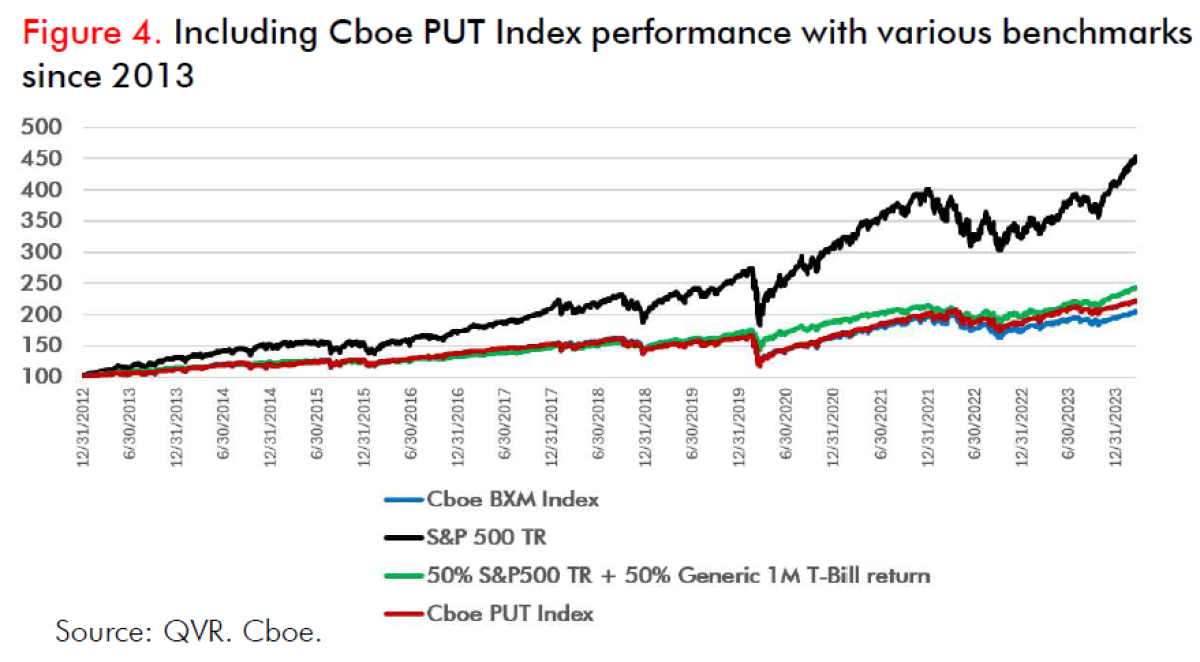
Call and put write strategies have roughly the same downside risk (down capture) as underlying equity market risk, with much less positive return in up markets. Figure 4 shows a simple visual of this concept during 2020’s performance. In a portfolio context, adding negative convexity strategies with low returns to the upside and high correlation to risk assets to the downside is not additive to portfolio performance.
As a reminder, we do not mind these product-based and price insensitive flows as it creates opportunity for us within both our Absolute Return portfolios and specifically to our Convexity Alpha series, bringing an opportunity of long convexity and negative correlation.
Note the difference in Figure 4 between long-term call option selling (BXM Index) and put option selling (PUT Index) returns, for similar strike ranges, as these returns do not not have anything to do with “the demand for insurance” or behavioral factors.
(Click on image to enlarge)
Besides some small Cboe benchmark implementation mechanics, Put-Call parity holds true and dictates that long equity plus short at-the-money calls is roughly the same as short at-the-money puts.
Again, in this scenario, an investor would have been better off in a portfolio comprised of 50% S&P 500 total return plus 50% U.S. T-Bills.
The Third Wave
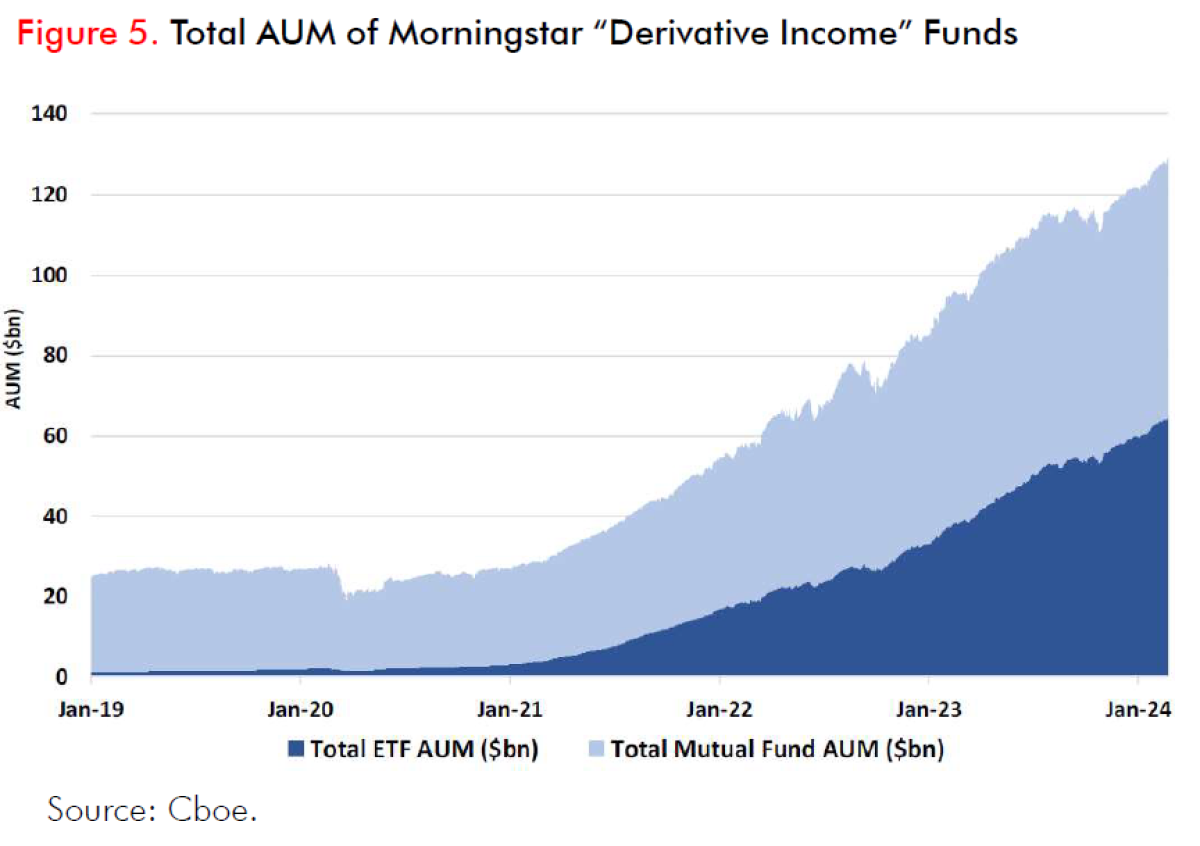
Figure 5 depicts the third wave of growth of option selling strategies. This is a direct result of a new marketing spin, “derivative income” and is in part fueled by another sharp market decline in 2020, similar to the reaction post-2008 GFC. This trade flow, without a doubt, is contributing to a large and still growing structural dislocation which is not compensating “insurance sellers” enough for selling options, therefore severely deteriorating returns. What’s worse is when you combine call selling in any form with a combination of downside put or put spread buying.
(Click on image to enlarge)
(Click on image to enlarge)
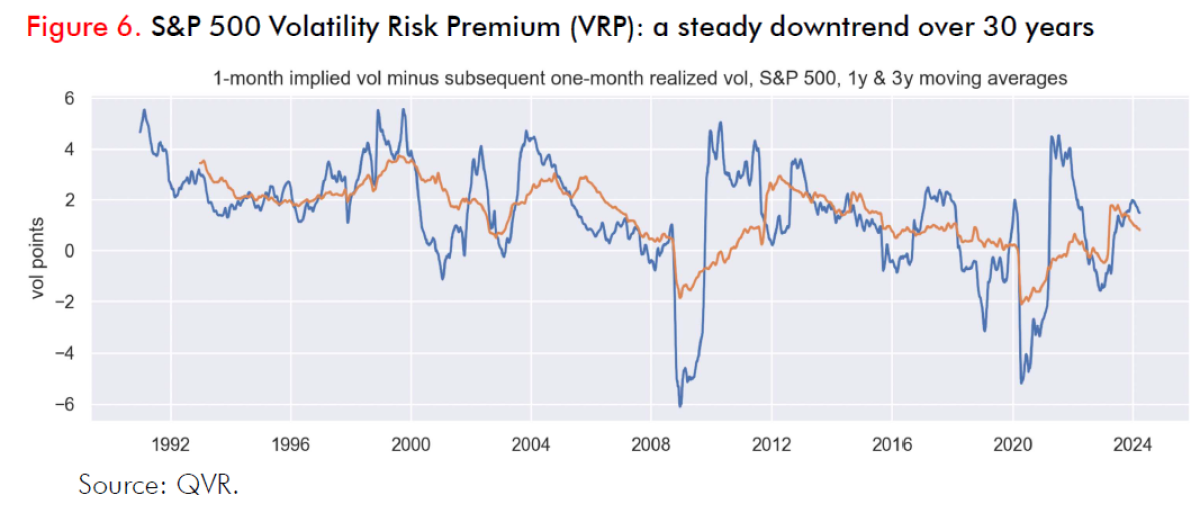
Figure 6 brings us back to our opening statement. If you run a backtest on a long historical time period where the relevant market was small and the relevant strategy had no material institutional capital, you will get a very different answer than the go-forward answer when institutional capital shows up.
Post-2008 GFC, picking up in 2013 and again in 2020, institutional capital has showed up and with quite the marketing spin and asset managers launching new products. We don’t mind this opportunity set.
About the Authors
Scott Maidel joined QVR from Gladius Capital Management where he was most recently a Director of Institutional Solutions. He was previously Senior Portfolio Manager, Equity Derivatives at Russell Investments and Associate Director, Global Trading and Trade Research at First Quadrant. Scott has over 15 years of trading and portfolio management experience with global derivatives.
Scott holds a B.Sc. in Investments and Financial Markets from the University of Southern California, an MBA from Pepperdine University and is a Harvard Business School alumni of the Program for Leadership Development (PLD). Scott is a CFA charter holder and Financial Risk Manager (FRM) certified.
Steve Richey is co-CIO, Head of Convexity Alpha at QVR managing the QVR Market Neutral, Hedged Equity and Volatility Hedge strategies. Steve has long career success generating alpha from dislocations in S&P 500 option markets. Steve has spent over 25 years researching and refining S&P 500 trading strategy both professionally and personally.
Steve started his trading career at First Quadrant and in his 11 years there, he attained the position of Partner and Director of Trading and Global Options Strategies where he oversaw a $3+ Billion systematic volatility program at its peak. Steve more recently was a PM at Capstone and Parallax. Steve holds a B.Sc. And MBA from Hawaii Pacific University and is a CFA Charterholder.
More By This Author:
Private Equity Continuation FundsProration -- Friend or Foe?
A Step Beyond Timber: Considering Private Equity Investments In Wood Products Manufacturing In The United States


Comments
Log in or sign up to join the conversation.