GDX Lower Low Sequence Supports More Downside
The short-term Elliott wave view in GDX suggests that the cycle from the 5 May 2023 peak is showing a 5 swings lower low sequence in higher time frame charts. Supporting more downside in the instrument. The decline from that peak is unfolding as an Elliott wave zigzag correction where wave (A) ended at $30.11 low. Wave (B) bounce unfolded as a lesser degree flat correction where wave A ended at $32.30 high. Wave B ended at $28.76 low, and wave C ended at $32.92 high thus completing wave (B).
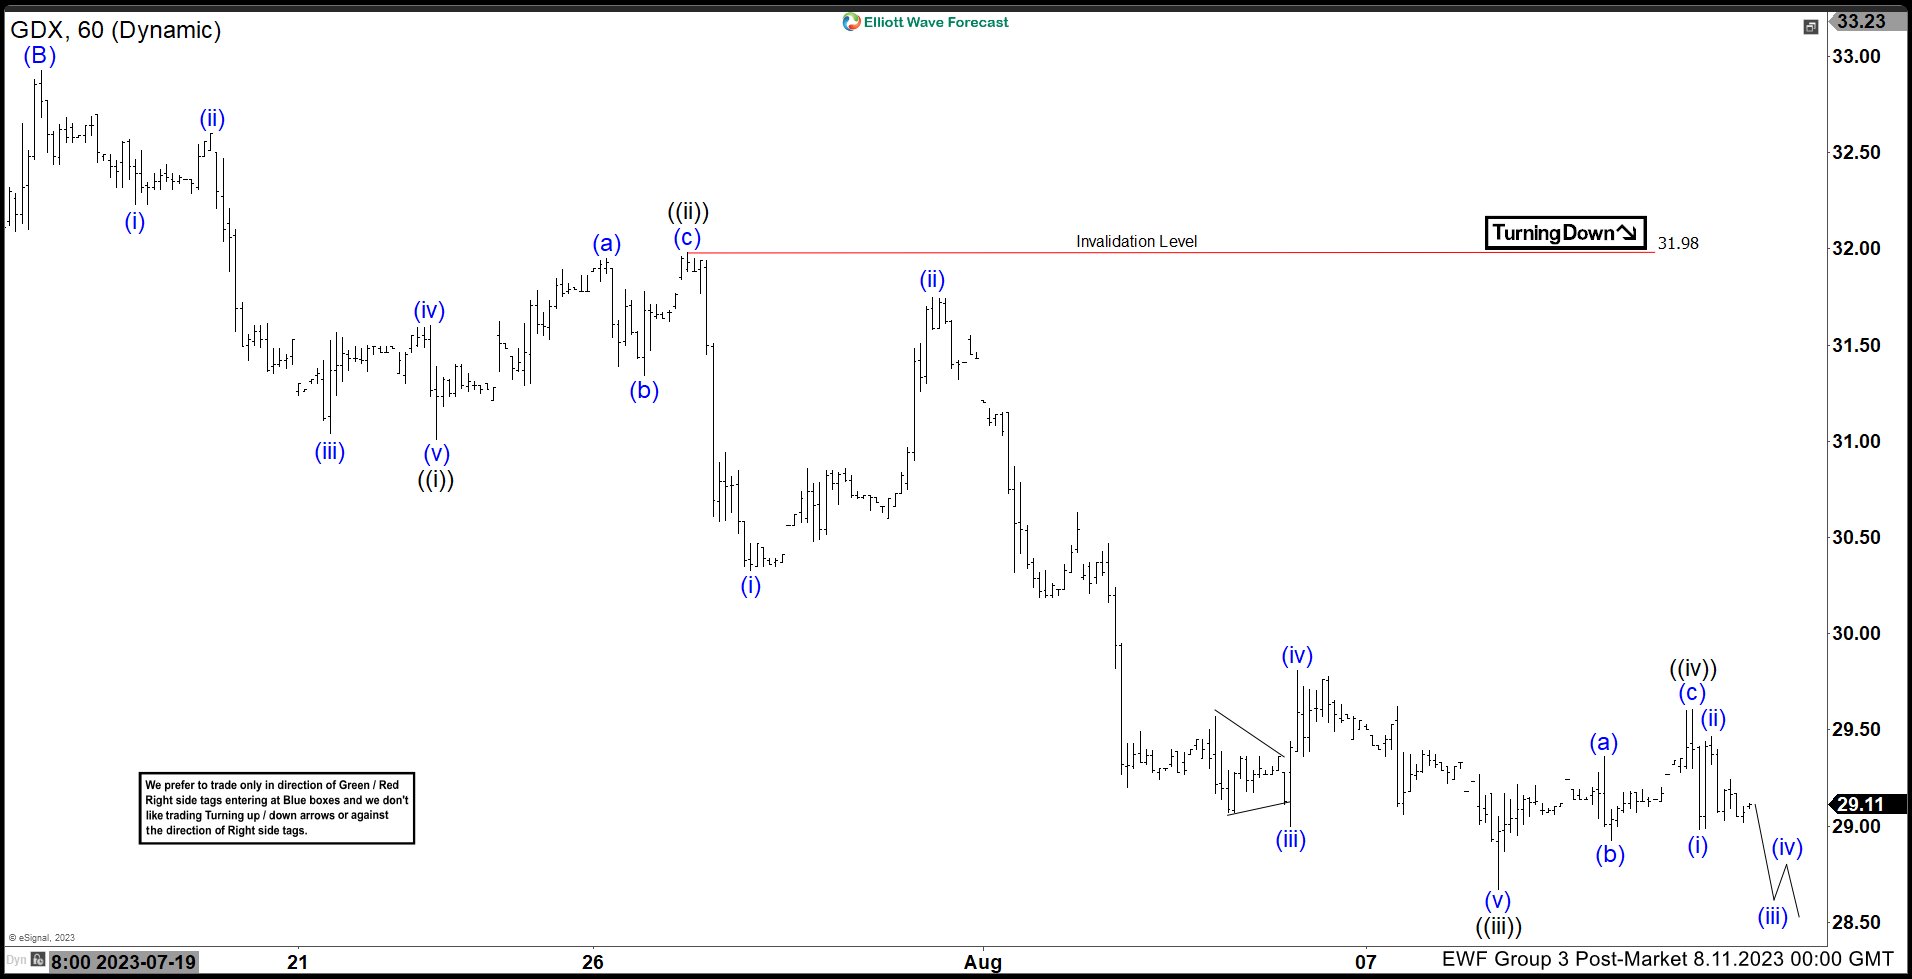
Down from wave (B) high the decline is unfolding as an impulse sequence favoring more weakness. Whereas wave ((i)) ended at $31.01 low. Wave ((ii)) ended at $31.98 high, wave ((iii)) ended at $28.67 low, wave ((iv)) ended at $29.61 high. Below from there, wave ((v)) remains in progress with a minimum extension target coming at $28.45- $28.09 area lower before the next bounce happens. Near-term, as far as bounces fail below $31.98 & more importantly below $32.92 high the GDX is expected to extend lower to reach the extreme from May peak towards $26.77- $22.98 target area before a turn in favor of the ETF happens.
GDX 1 Hour Elliott Wave Chart From 8.11.2023
(Click on image to enlarge)
More By This Author:
Oil Impulse Sequence Supports More UpsideStarbucks Signals Next Investment Move
Elliott Wave Zig Zag Pattern Forecasting The Path For The Dollar Index
Disclaimer: Futures, options, and over the counter foreign exchange products may involve substantial risk and may not be suitable for all investors. Leverage can work against you as well as for ...
more


