Friday's Short-Term Uptrend Could Launch A Summer Rally
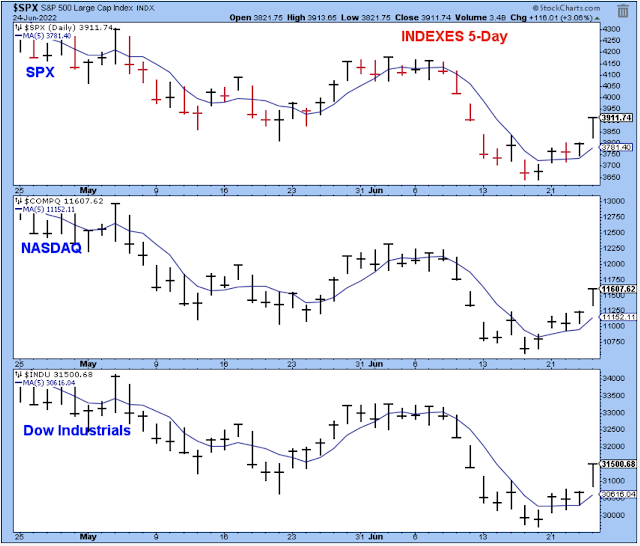
A new short-term uptrend started on Friday, June 25, and it looks like it could be setting up a decent summer rally.
It felt as though the market wanted to rally starting on Tuesday. However, it wasn't until Thursday that the market was able to close at the session high, and this hinted that a rally was brewing for Friday.
The bullish percents started inching higher on Tuesday, which was another hint of a change in trend, and this was very helpful for trading. The tiny bit of strength off of the extreme lows suggested closing out the shorts and putting the proceeds into long positions. Now, this chart suggests a nice, bullish setup for trading in the coming week.
This broad market index hit a lower low, but there is some bullish divergence with its momentum indicator. This means that the downside momentum is easing up a bit, so I like the chances that this index will move up and through the initial resistance towards its mid-April highs.
Here is another chart showing the weakness of the market, but with slightly improved breadth. The summation marked a higher low, and it has now started to turn upwards.
The market is still aligned in bearish fashion with the major indexes below their 50-day averages, but they are ready to challenge their averages, and my guess is that they will break out above.
I mentioned earlier that the market wanted to rally starting on Tuesday, but the level of new 52-week lows was too high for the market to rally. It wasn't until Friday that new lows settled down and let the indexes move higher. There are still too many new lows, but this is much more manageable.
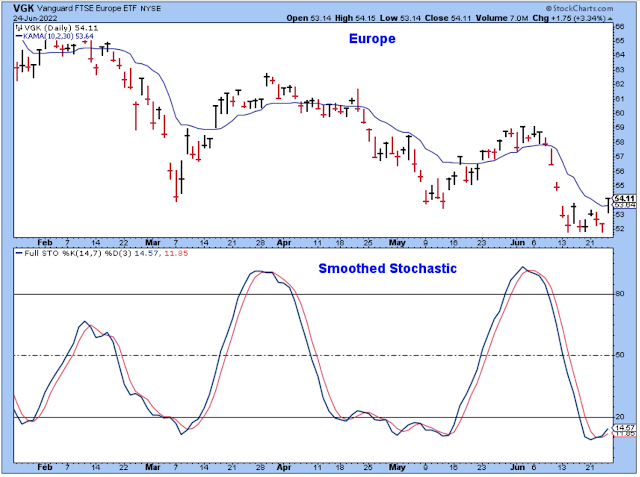
I added this chart of the Europe market (denominated in US dollars) to show that the basic stochastic is starting to work well, and to show its short-term cycles. Thursday was a little confusing as the US market rallied a bit, but this ETF looked like it wanted to continue to break down. Instead, the price action turned out to be a successful test of support and created this tiny base for it to bounce higher.
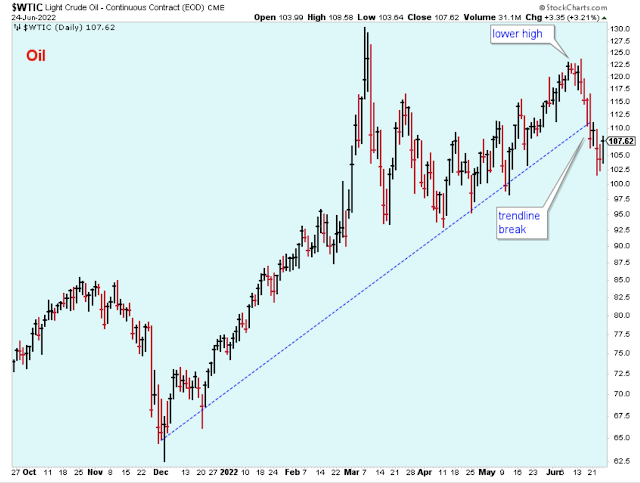
The price of oil was the big news this past week, as it pulled back from the highs that had really started to scare people. The beaten-down Nasdaq stocks responded positively to this reversal for oil, so let's hope that oil prices continue to move lower.
Here is a look at the ETF of oil stocks. It has been a really rough couple of weeks, and the price has pulled back right to the 30-week average. The question now is, do you buy this pullback? I honestly don't know. But I'm very tempted.
Treasury bonds and stock prices started to correlate in 2021, which was a sign that inflation had taken hold of the economy. This is very interesting for people who like to watch inter-market behavior.
Bottom Line: I am about 35% long stocks and 5% short via options, and I have a tiny position that is short the gold miners. I'll probably add to longs on Monday, and then mostly sit and wait for the short-term market cycle to reach its highs again in a couple weeks.
Last week there was a request to see the list of the indicators that I use to determine the short-term trend. These are basic indicators and I don't think any of them will be a surprise. My suggestion is to put them in a single list on StockCharts and scroll through it every day after the market closes in order to get to know them and to see how they behave. The subtleties will eventually jump out at you, and that can be very helpful for trading.
- PMO Indexes.
- McClellan Oscillators.
- Summation Indexes.
- Bullish Percents.
- Moving Averages of the Major Indexes.
- Put/Call Indexes.
- 52-week New Lows.
- VIX/VXN.
- Junk Bond ETFs.
- Advance/Declines.
- Up/Down Volume.
- Buy-Write Indexes.
- Momentum Indicators of the Major Indexes.
Outlook Summary
- The short-term trend is up for stock prices as of June 24.
- The economy is at risk of recession as of March 2022.
- The medium-term trend is down for treasury bond prices as of Jan. 3 (prices down, yields up).
Disclaimer: I am not a registered investment adviser. My comments reflect my view of the market, and what I am doing with my accounts. The analysis is not a recommendation to buy, sell, ...
more


