
Fighting Big Oil

Image Source: Unsplash
I currently have three ETF positions: puts on XLU, IWM, and XOP. It’s that last one that I wanted to talk about.
Below is the 60-day minute bar chart of XOP which, like everything else, ripped higher recently. I wanted to take advantage of its proximity to that huge blob of overhead supply. My options are March 15th $140 puts.
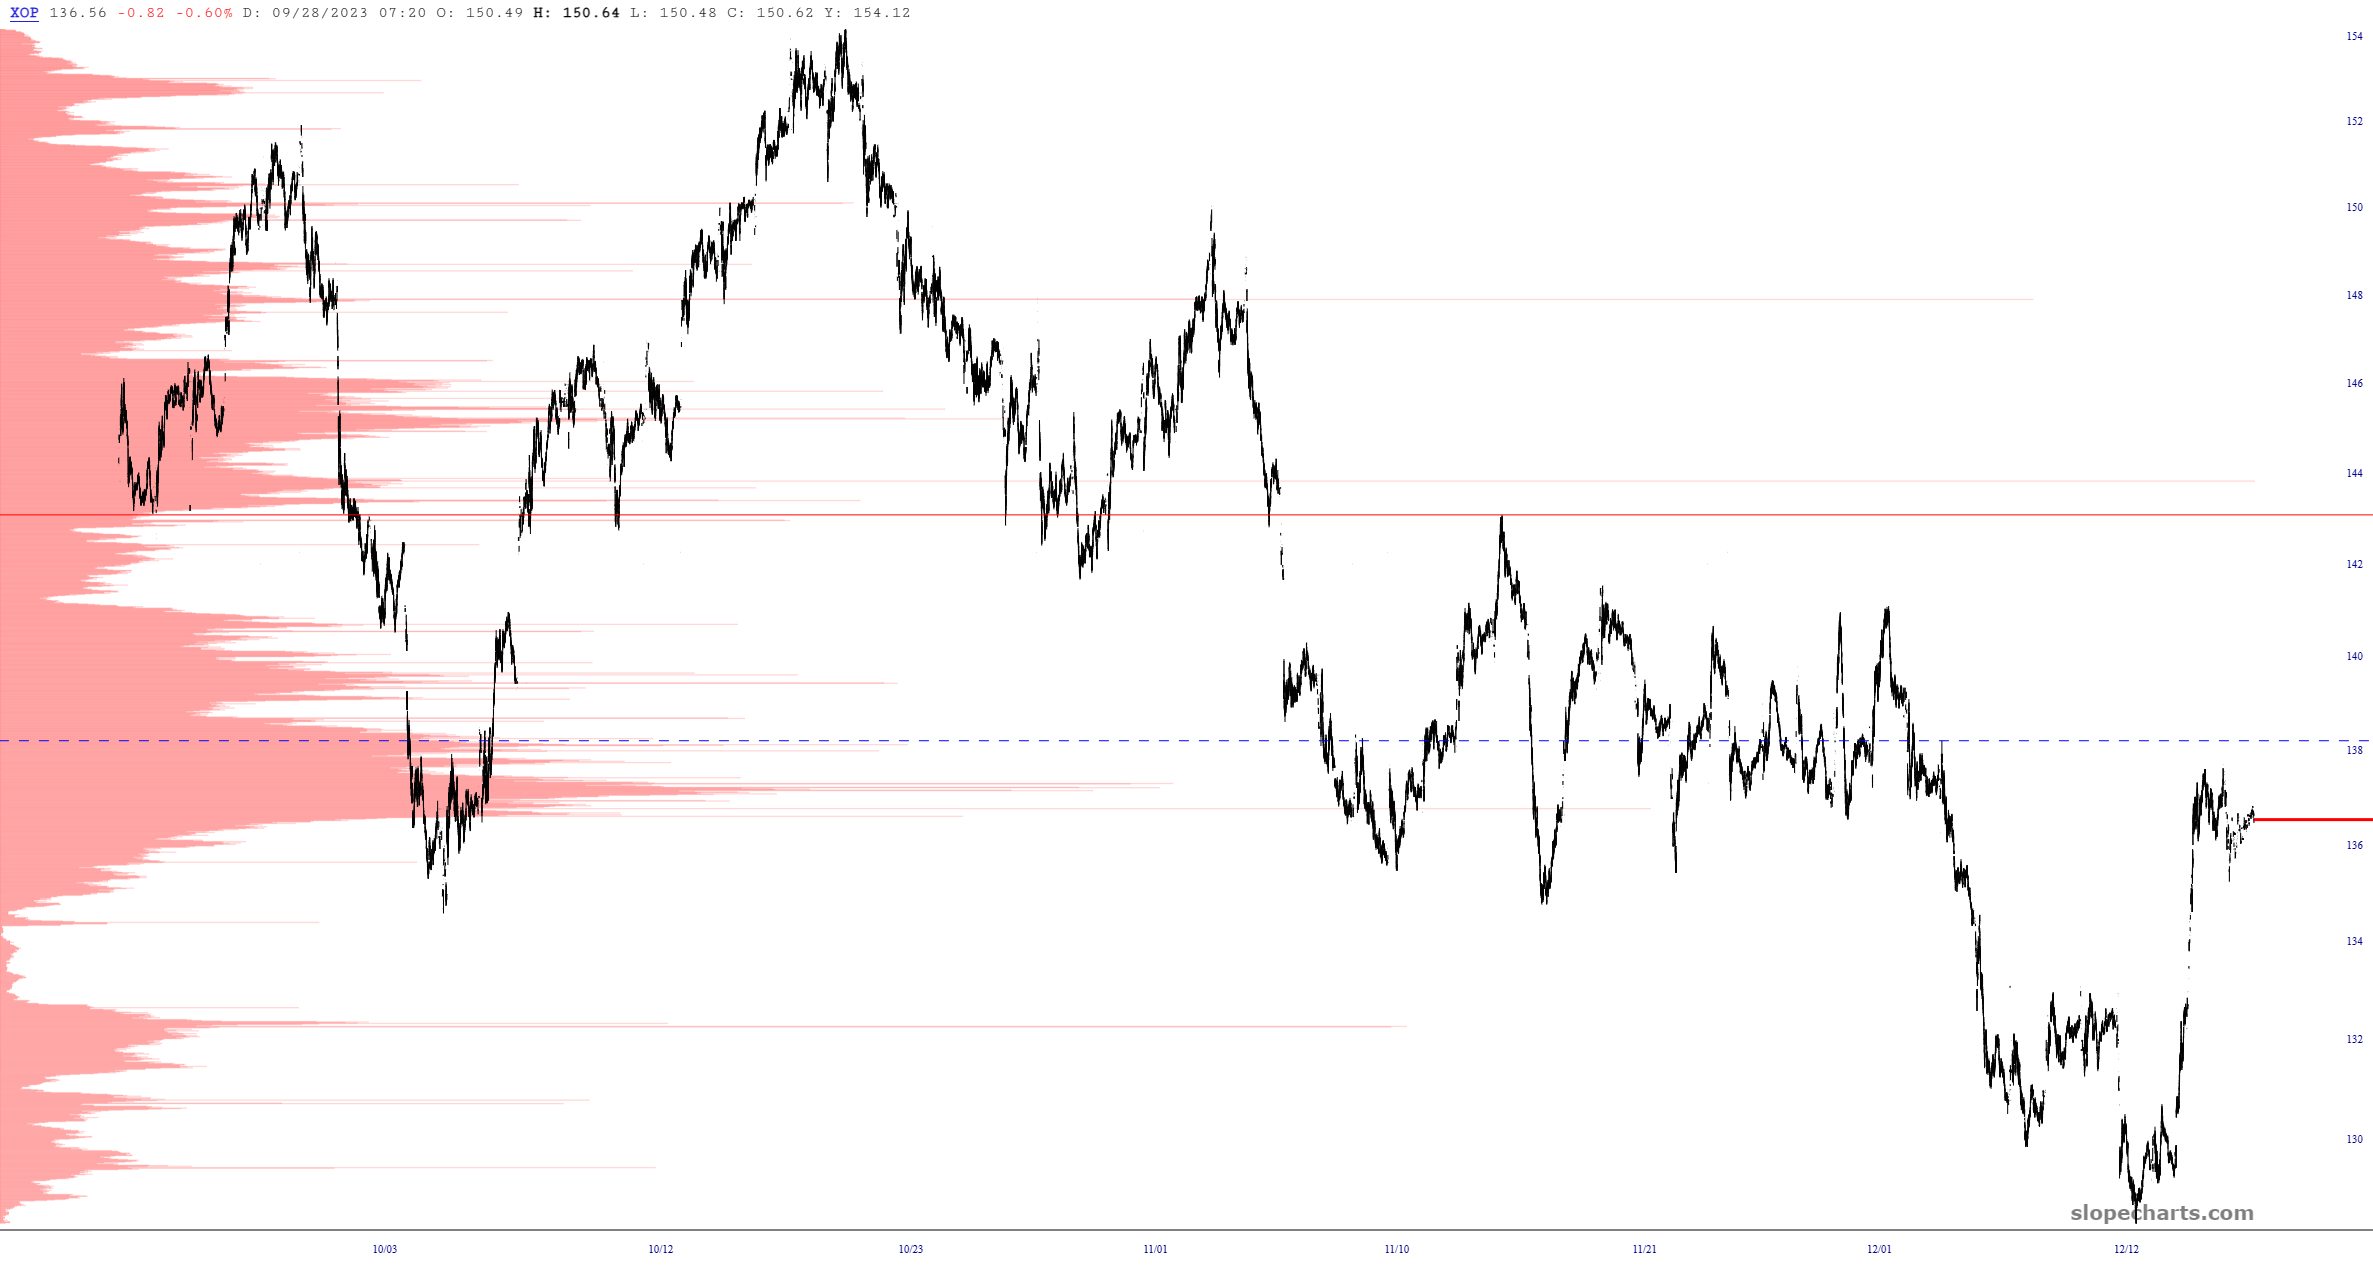
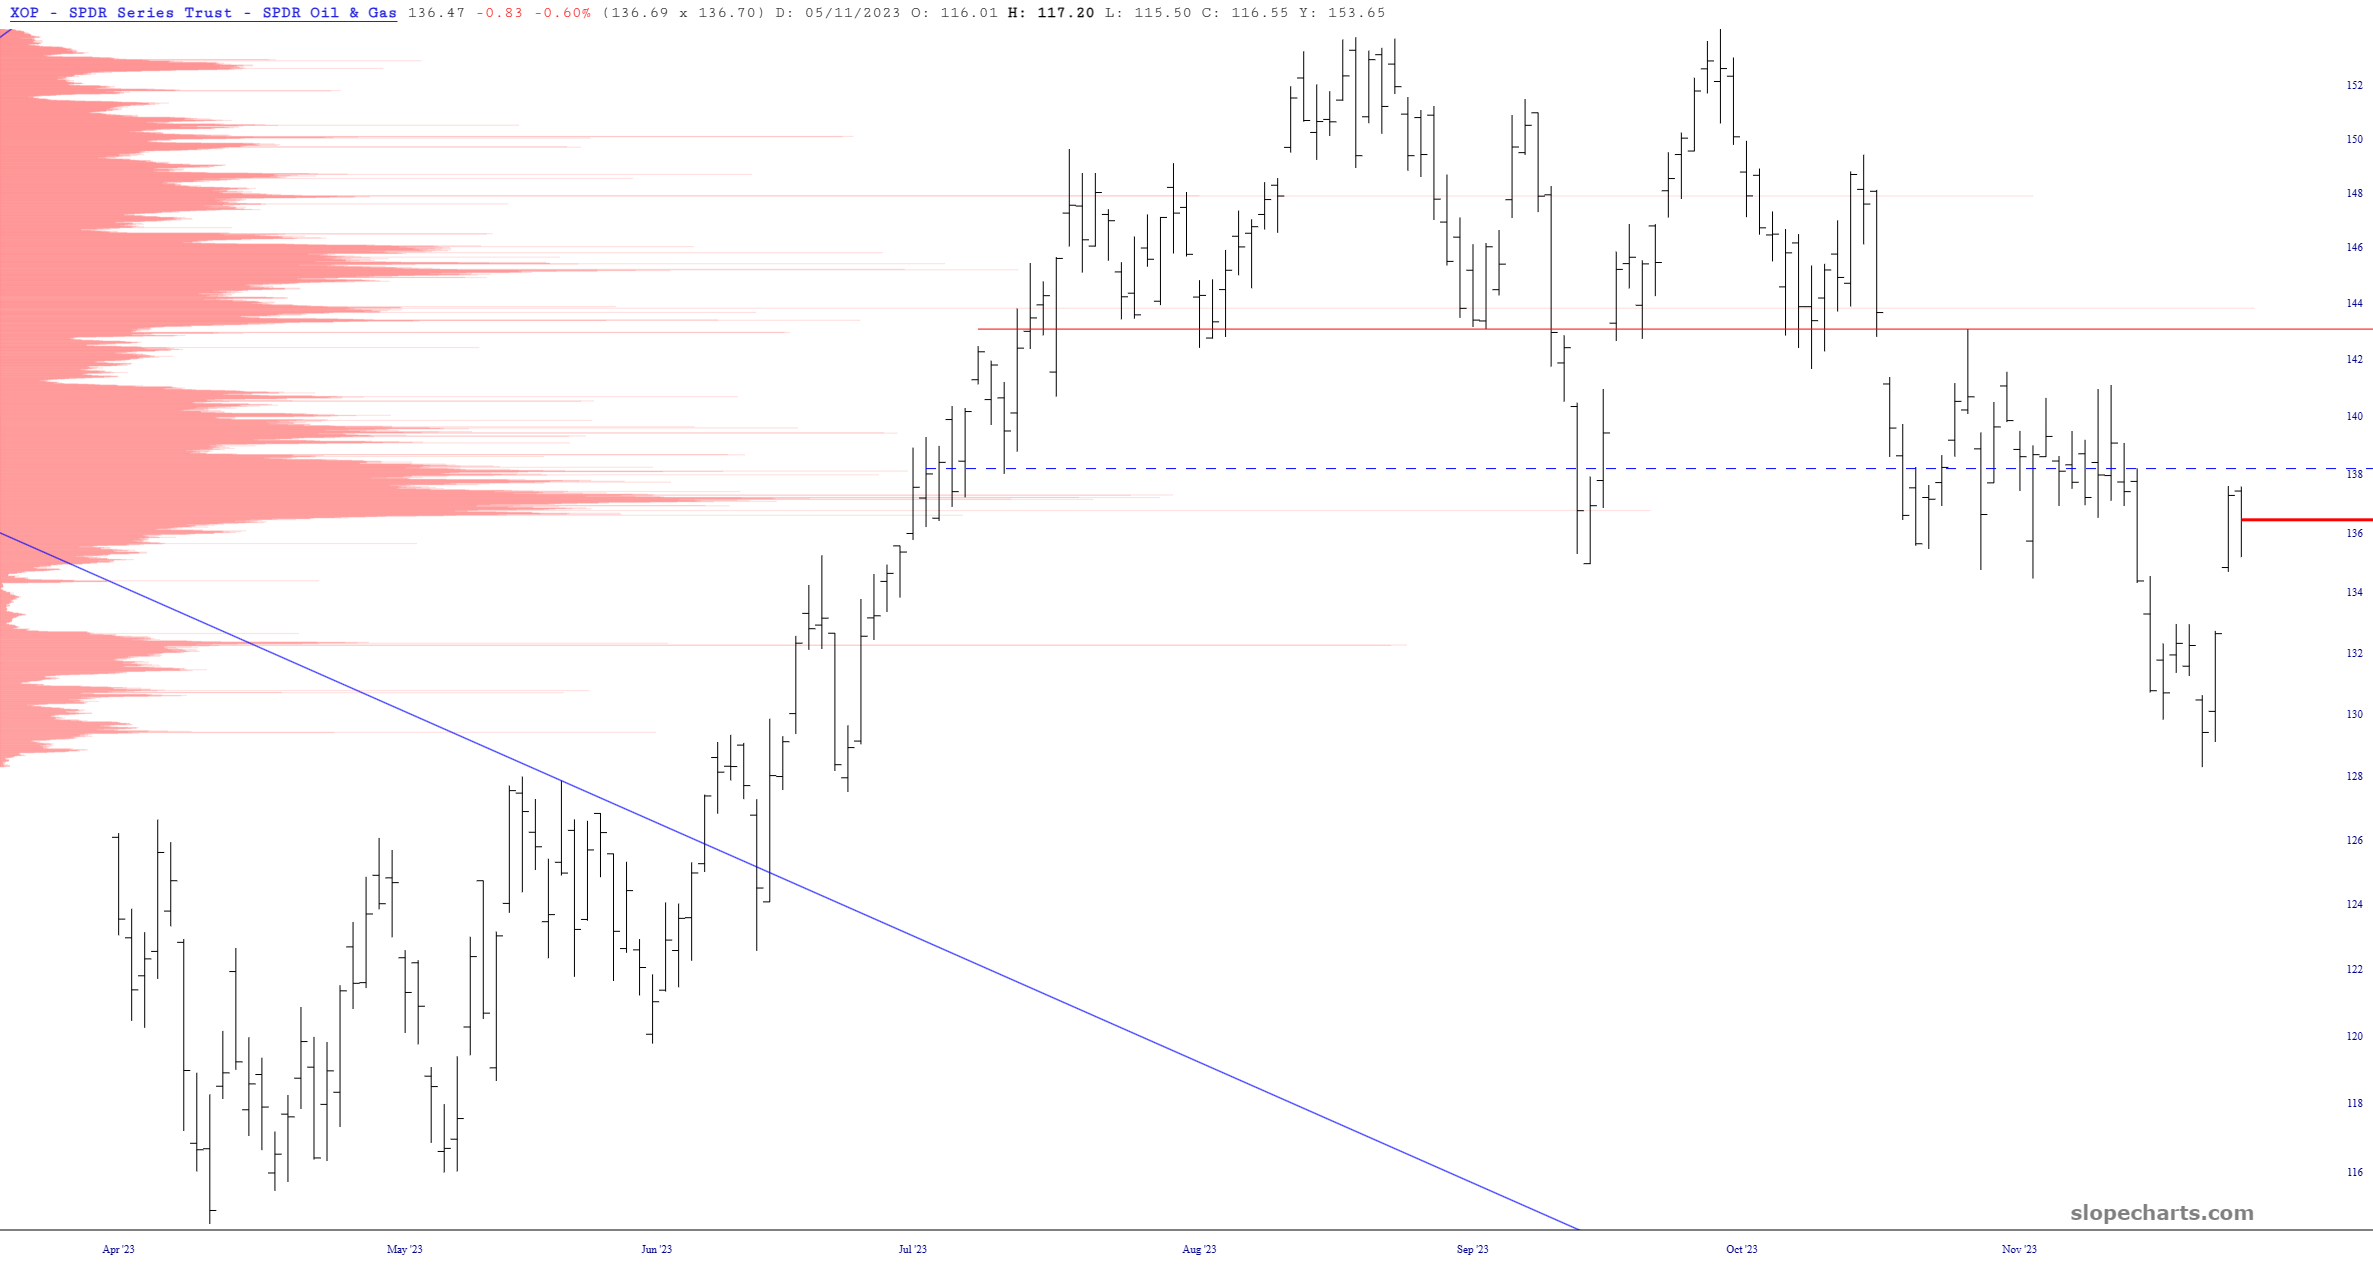
Here is the daily chart, still shown with the volume profile, to illustrate resistance. My stop-loss on this is at $138.
More By This Author:
Etsy Responds To Growing E-Commerce Competition With Staff ReductionDeclining Fiscal Strength Reflected In French Manufacturing PMI
The Bludgeoning Of The Bears Continues
I tilt to the bearish side. Slope of Hope is not, and has never been, a provider of investment advice. So I take absolutely no responsibility for the losses – – or any credit ...
more
How did you like this article? Let us know so we can better customize your reading experience.

Comments
Leave a comment to automatically be entered into
our contest to win a free Echo Show.

