
Emerging Fibonacci
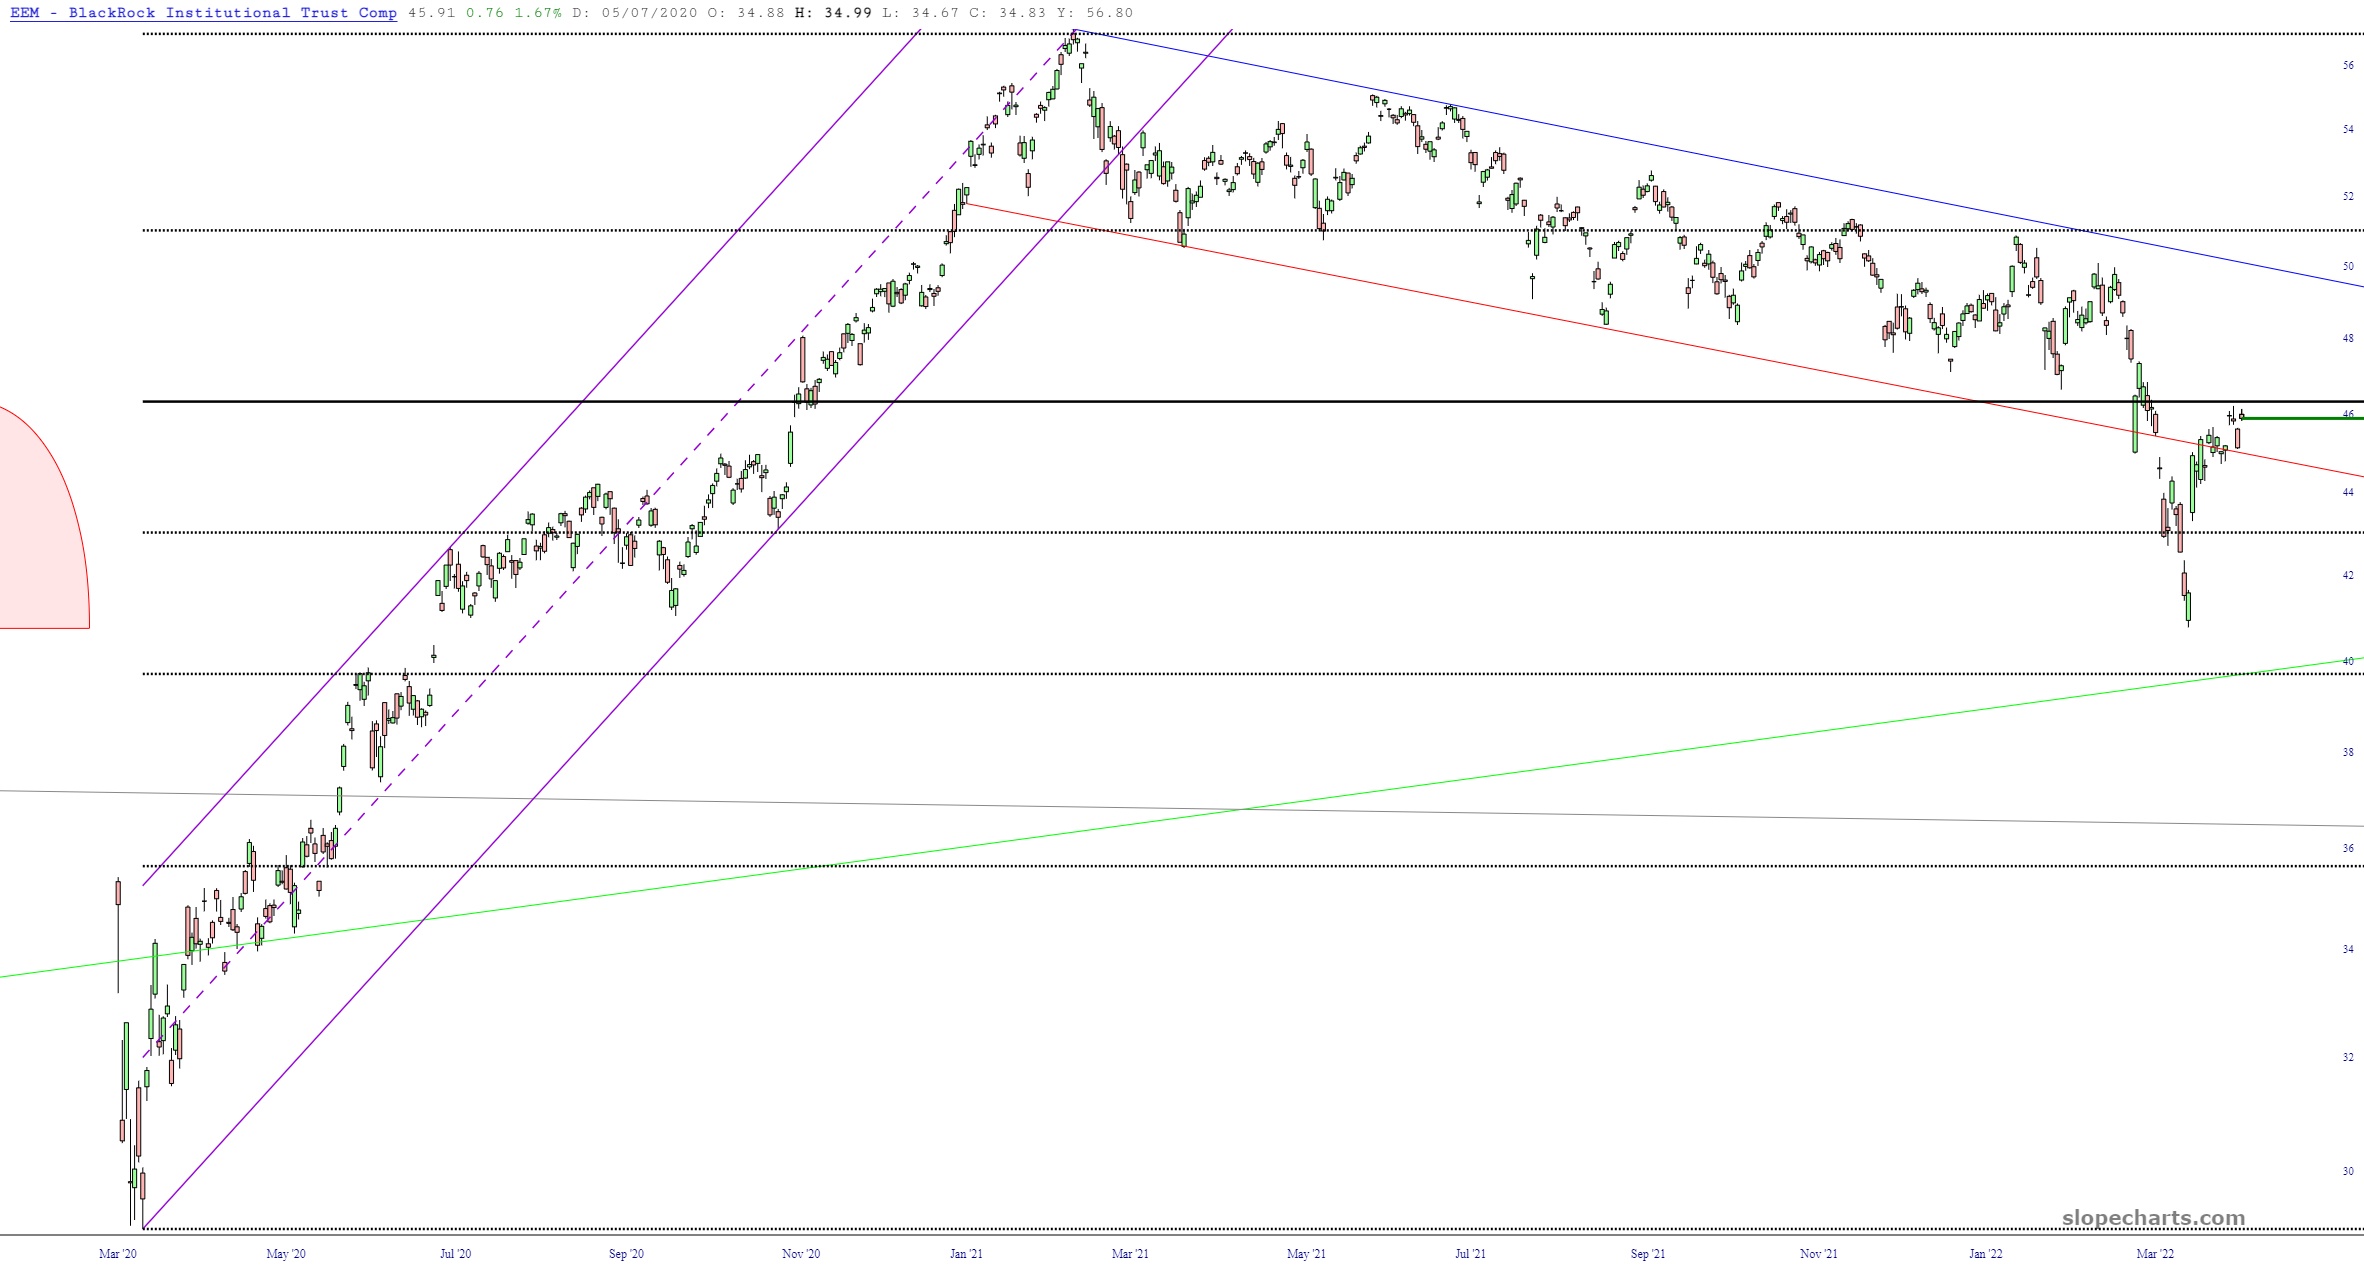
Want to see something cool? Sure you do! Let’s take a look at the heavily-traded emerging markets fund symbol EEM. I have drawn a Fibonacci Retracement form the Covid crash bottom (March 23, 2020) to the recovery top (incredibly, way back in February 16, 2021). Pay particular attention to the retracement that I’ve put in bold, which is at the 61.8% level.
(Click on image to enlarge)
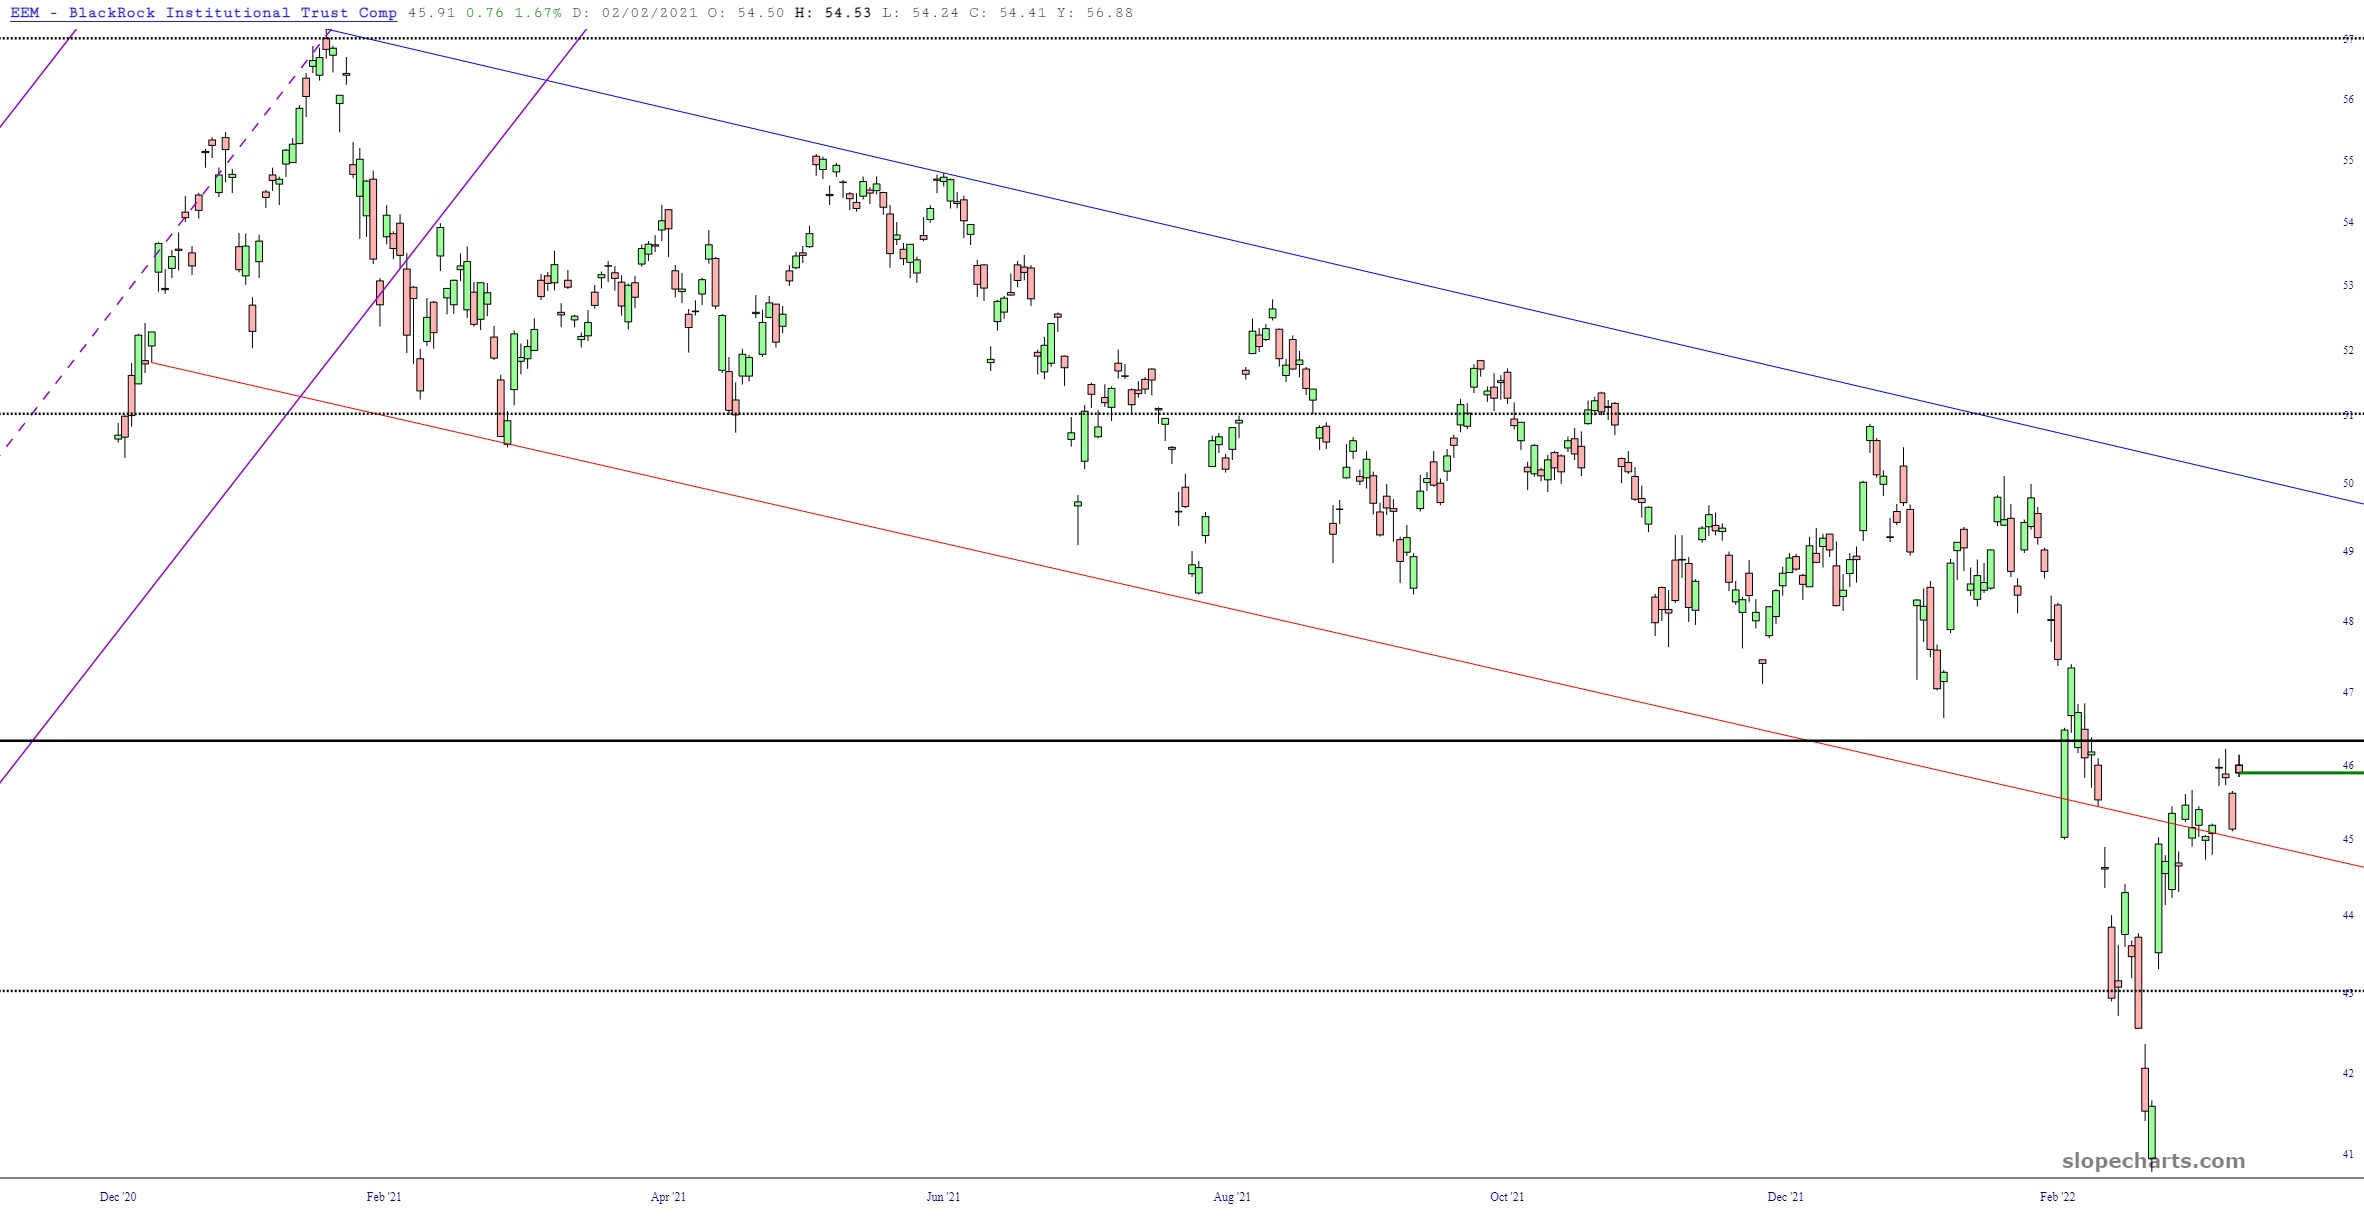
As we look more closely, we can see that after the approximately 15% pop we experienced in the second half of March, this has stalled out. My contention is that firm resistance exists at the line, which is 46,34:
(Click on image to enlarge)
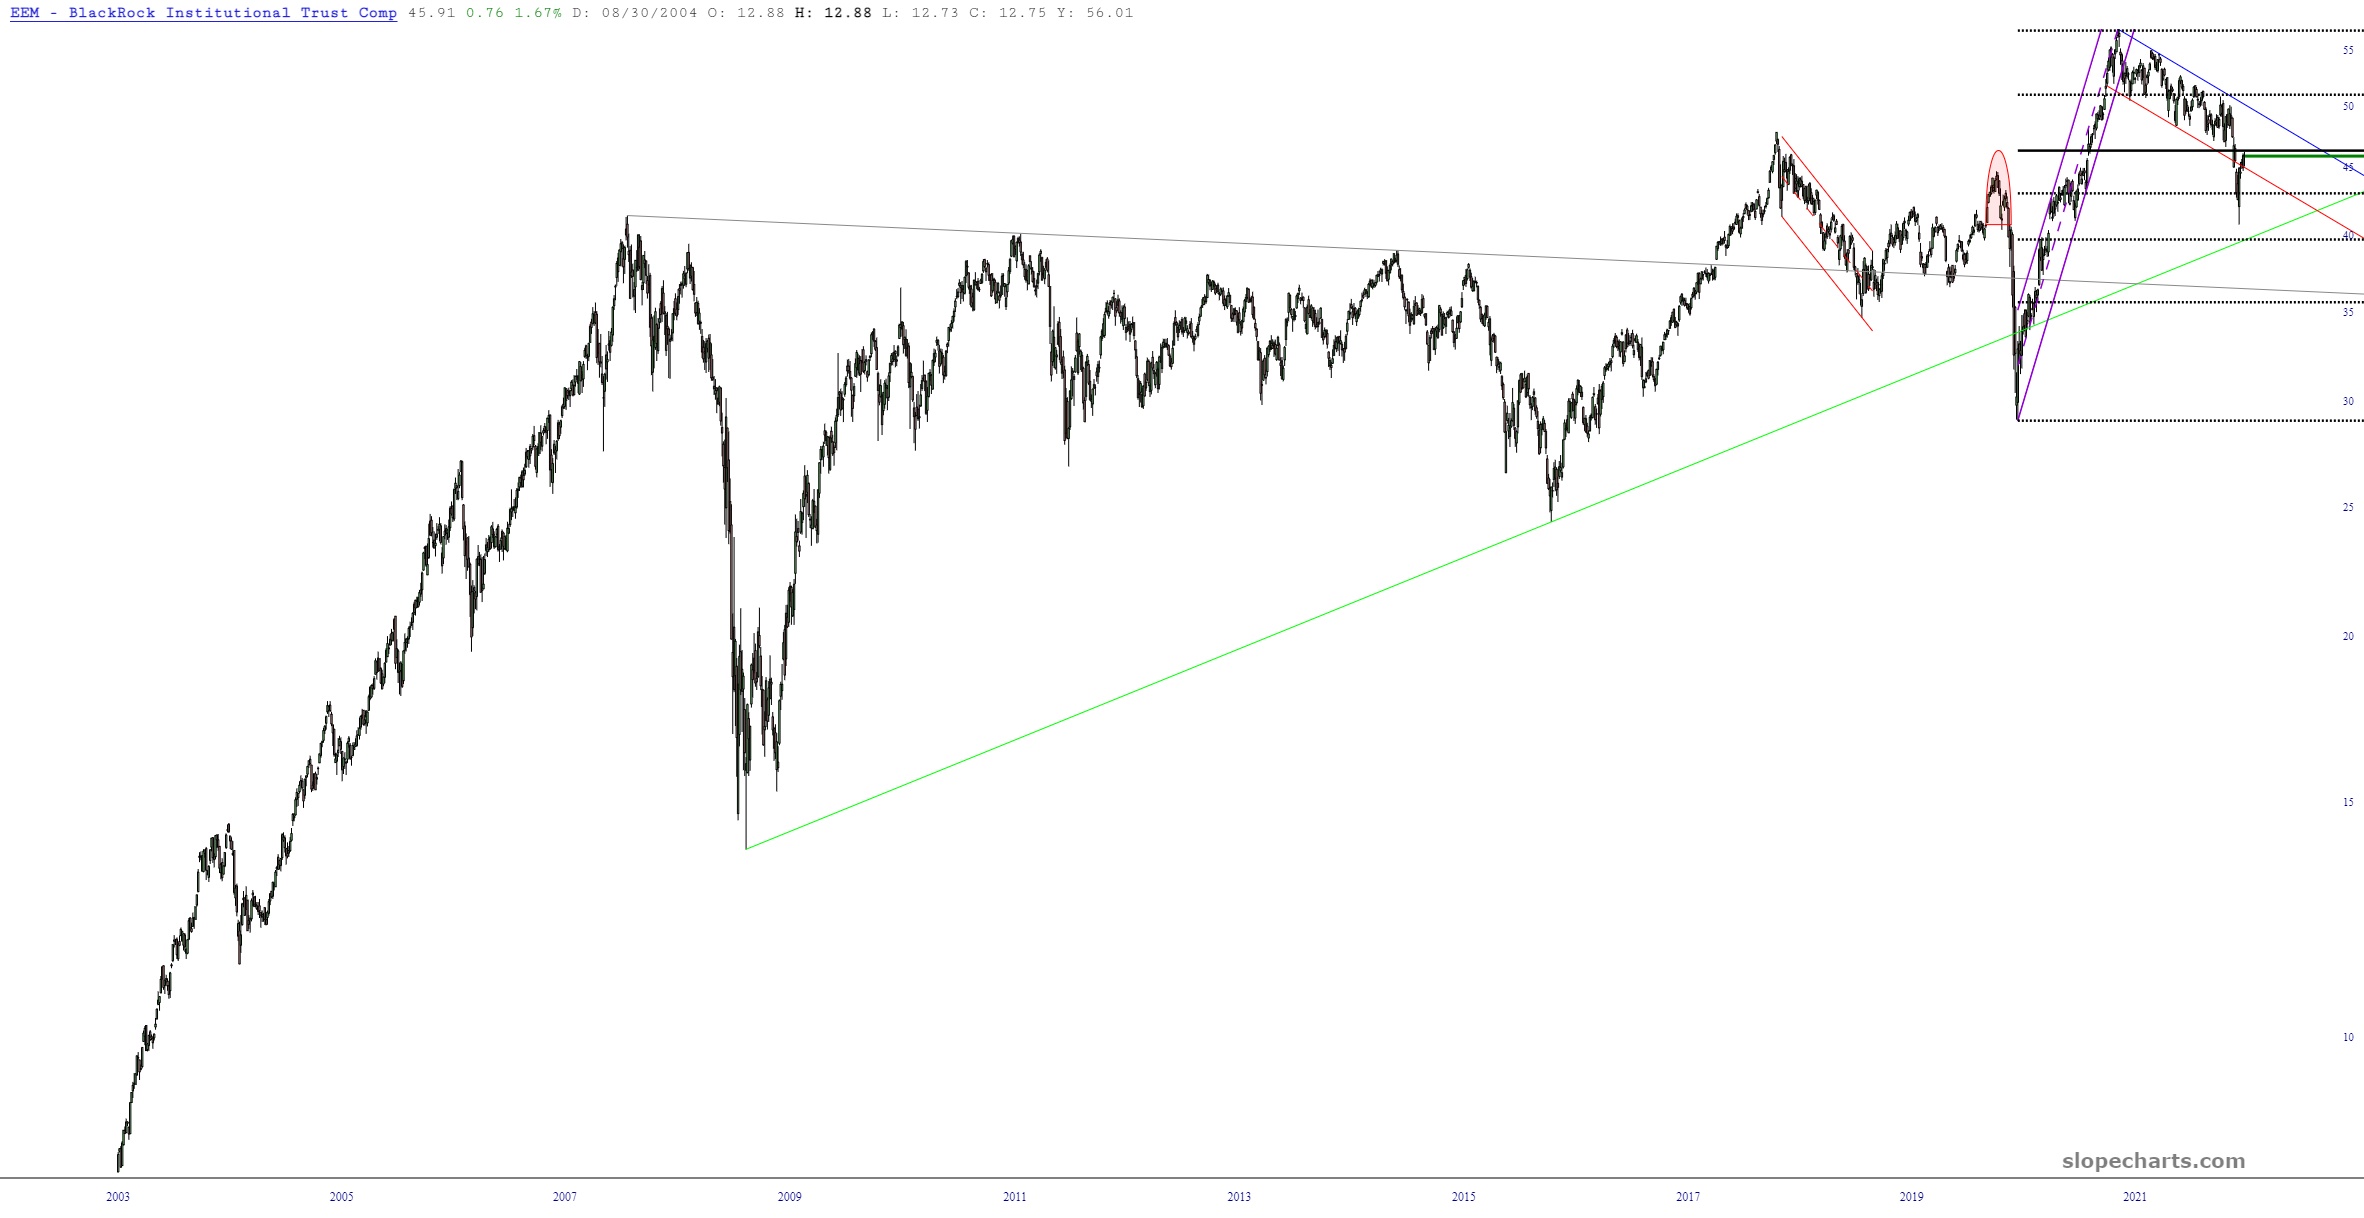
Here is the lifetime view, to put things into perspective.
(Click on image to enlarge)
How did you like this article? Let us know so we can better customize your reading experience.

Comments
Leave a comment to automatically be entered into
our contest to win a free Echo Show.

