

Hello fellow traders. In this technical blog we’re going to take a quick look at the Elliott Wave charts of Dollar Index. As our members know, DXY has recently given us correction against the 104.72 peak. Recovery formed Elliott Wave Wave Zig Zag Pattern. In the further text we are going to explain the Elliott Wave Pattern and the Forecast.
Before we take a look at the real market example, let’s explain Elliott Wave Zigzag pattern.
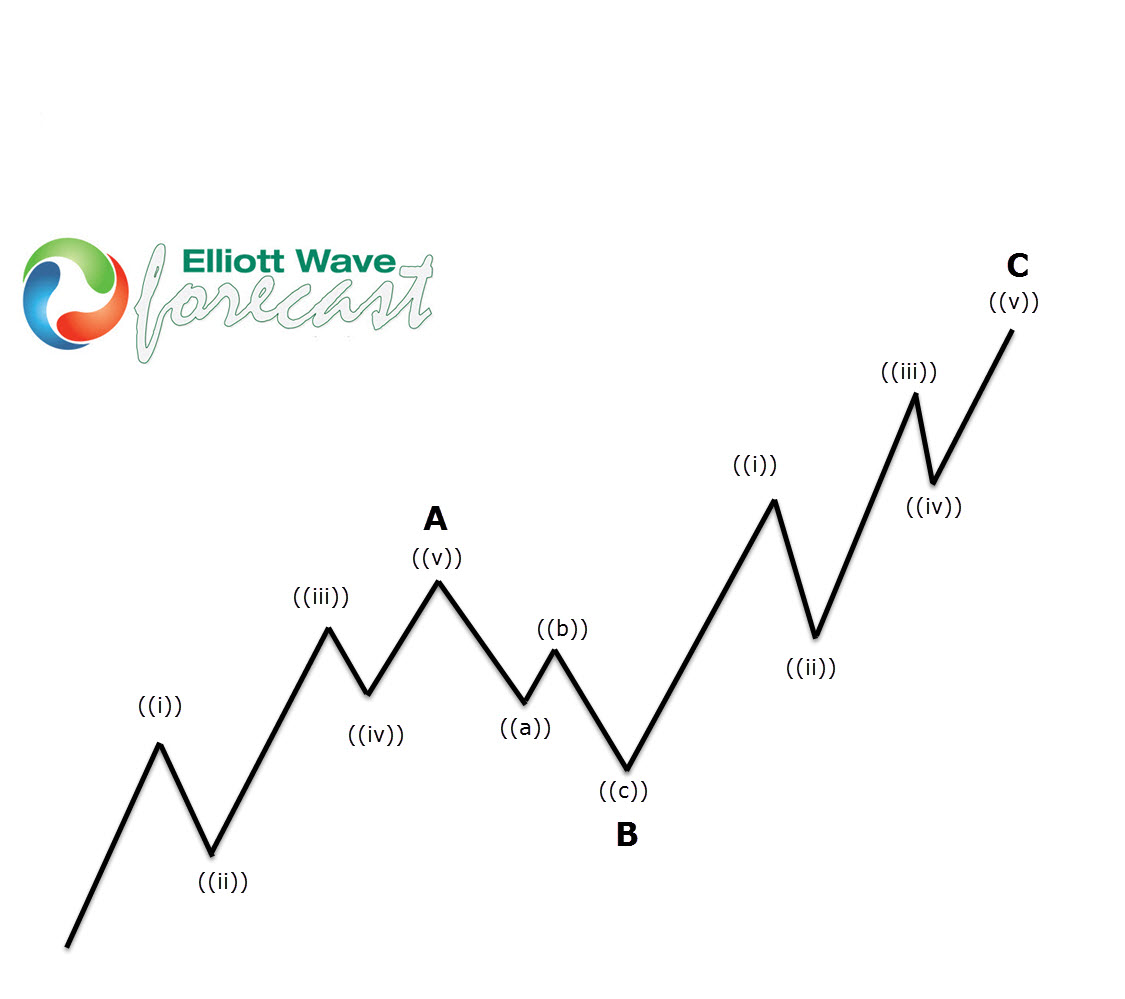
Elliott Wave Zigzag is the most popular corrective pattern in Elliott Wave theory . It’s made of 3 swings which have 5-3-5 inner structure. Inner swings are labeled as A,B,C where A =5 waves, B=3 waves and C=5 waves. That means A and C can be either impulsive waves or diagonals. (Leading Diagonal in case of wave A or Ending in case of wave C) . Waves A and C must meet all conditions of being 5 wave structure, such as: having RSI divergency between wave subdivisions, ideal Fibonacci extensions and ideal retracements.
DXY H4 Elliott Wave Analysis 07.27.2023
DXY is showing higher high sequences from the 07/13 low. We got 5 waves up in the first leg (a). Then the price has given us corrective pattern in (b) blue, after which we got rally toward new highs again. At the moment Dollar index is showing higher high sequences. Recovery looks incomplete, calling for further strength toward 102.61-103.1 area. More upside should ideally follow in DXY as far as the price stays above (b) blue low : 100.55. As the first leg of correction has 5 waves structure, we assume recovery is having form of Elliott Wave Zig Zag. Consequently we expect to see 5 waves up in the (c) leg as well.
 Elliott Wave Zig Zag Pattern Forecasting The Path")
DXY H4 Elliott Wave Analysis 07.27.2023
100.55 pivot held well during the short term correction and Dollar found further support as we expected. We got rally in Dollar index and target area is already reached at 102.61-103.1. As far as the price stays below 102.84 high, we can count correction completed. However , we would like to see further separation lower from that high to confirm next leg down is in progress.
Keep in mind market is dynamic and presented view could have changed in the mean time. You can check most recent charts in the membership area of the site. Best instruments to trade are those having incomplete bullish or bearish swing sequences.We put them in Sequence Report and best among them are shown in the Live Trading Room.
 Elliott Wave Zig Zag Pattern Forecasting The Path")
More By This Author:
Vale SA Price Action Signals Further UpsideForex Vs. Options Trading: Which Is Better?
Enbridge Inc. Is Poised To Rally Soon From a Blue Box Area.


Comments
Log in or sign up to join the conversation.