Elliott Wave View: GDX Pullback In Progress
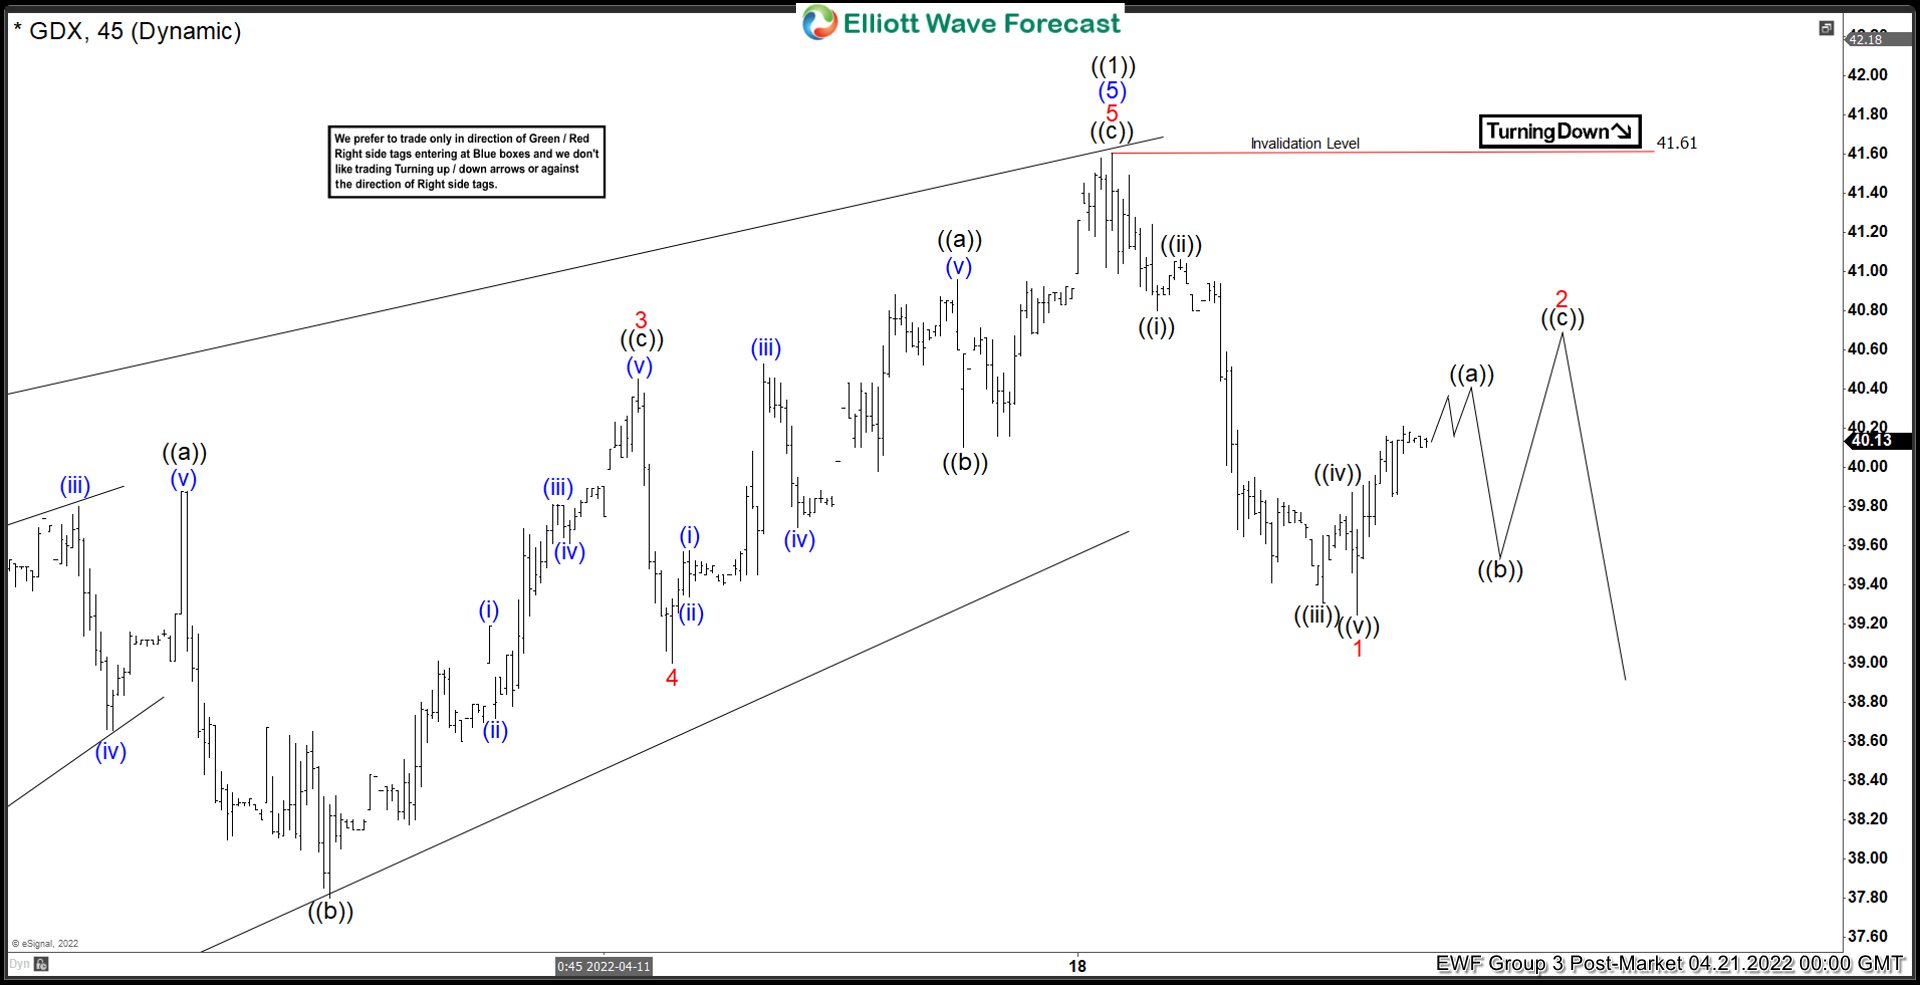
Short term Elliott Wave view in GDX suggests cycle from October 2021 low ended in wave ((1)) at 41.61 as an impulse Elliott Wave structure. Pullback in wave ((2)) is currently in progress with internal subdivision as a zigzag (A)-(B)-(C). The ETF is currently within wave (A) of ((2)) with internal subdivision as a 5 waves. Down from wave ((1)), wave ((i)) ended at 40.8 and rally in wave ((ii)) ended at 41.06. The ETF then extends lower in wave ((iii)) towards 39.31, rally in wave ((iv)) ended at 39.87. Final leg lower wave ((v)) ended at 39.25 which completed wave 1 of (A) in higher degree.
Wave 2 bounce is now in progress to correct the decline from April 18 peak before the ETF resumes lower. Internal subdivision of wave 2 is unfolding as a zigzag structure where wave ((a)) of 2 is expected to end soon. GDX should then pullback in wave ((b)) before another leg higher to end wave ((c)) of 2. Afterwards, it should resume lower in wave 3 to continue the correction to the cycle from October 2021 low. Near term, as far as pivot at 41.61 high remains intact, expect rally to fail in the sequence of 3, 7, or 11 swing for further downside.
GDX 45 Minutes Elliott Wave Chart
(Click on image to enlarge)
Disclaimer: Futures, options, and over the counter foreign exchange products may involve substantial risk and may not be suitable for all investors. Leverage can work against you as well as for ...
more


