Elliott Wave Forecast: SPDR S&P 500’s Path To Record Peaks
Image Source: Unsplash
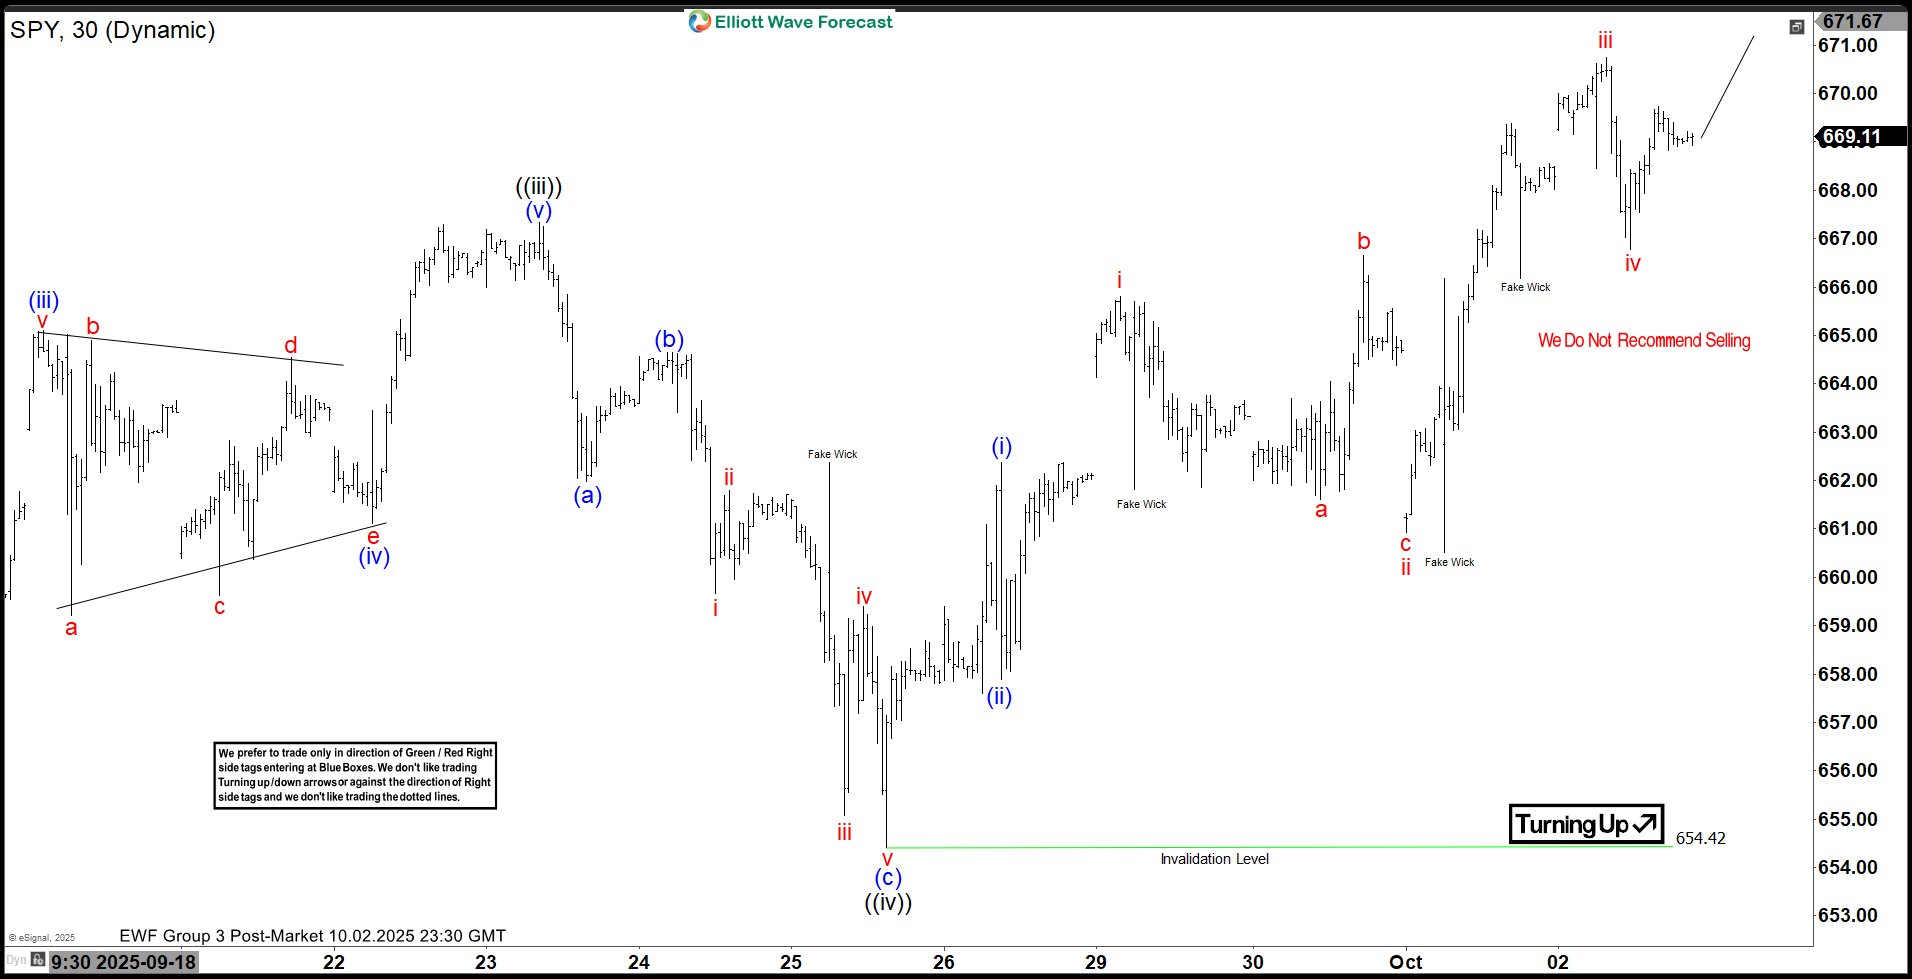
The Short-Term Elliott Wave analysis for the SPDR S&P 500 ETF (SPY), starting from August 2, indicates an ongoing impulsive rally. From the August 2 low, the ETF surged in wave ((i)) to 647.04, followed by a dip in wave ((ii)) concluding at 634.92. The ETF then climbed in wave ((iii)) to 667.34. A corrective pullback in wave ((iv)) formed a zigzag Elliott Wave pattern. From the wave ((iii)) peak, wave (a) declined to 661.98, wave (b) rallied to 664.65, and wave (c) dropped to 654.42, completing wave ((iv)).
The ETF has since resumed its upward trajectory in wave ((v)), exhibiting an impulsive structure with internal extensions. From the wave ((iv)) low, wave (i) reached 662.37, and a brief pullback in wave (ii) ended at 657.88. The ETF then nested higher, with wave i peaking at 665.8 and wave ii correcting to 660.93. Wave iii ascended to 670.74, followed by a wave iv pullback to 666.78. As long as the pivot low at 654.42 holds, the ETF should continue its upward momentum in the near term.
SPDR S&P 500 ETF (SPY) – 30 Minute Elliott Wave Technical Chart:
SPY – Elliott Wave Technical Video:
Video Length: 00:05:02
More By This Author:
Nasdaq On Track For Higher Wave 5 FinishGold Soars To All-Time Highs: Elliott Wave Outlook And Next Target
Light Crude Oil: Elliott Wave Outlook Points To Lower Prices
Disclaimer: Futures, options, and over the counter foreign exchange products may involve substantial risk and may not be suitable for all investors. Leverage can work against you as well as for ...
more


