East Asia ETF Breakdown: Hong Kong, Malaysia, And South Korea
Investor Takeaway
The purpose of this article is to initiate a comparative analysis on exchange-traded funds within the Emerging Market segment. Countries in discussion are Hong Kong, Malaysia, and South Korea. The Malaysia and Hong Kong ETFs are cost efficient options compared to the South Korea one. At the same time, exposure to the financial sector is less in the South Korea ETF relative to both the Malaysia and Hong Kong ETFs. Expectations related to financials exposure are a reflection of my personal risk assessment. I am distancing my ETF selection framework from non-U.S. financials exposure due to the uncertainty caused by the escalating tariff dispute between the U.S. and China. The intertwined nature of the global financial system is the causal mechanism of my framework. By seeking country ETFs that have limited financials exposure, I believe that investors can limit losses in the current macro-driven environment.
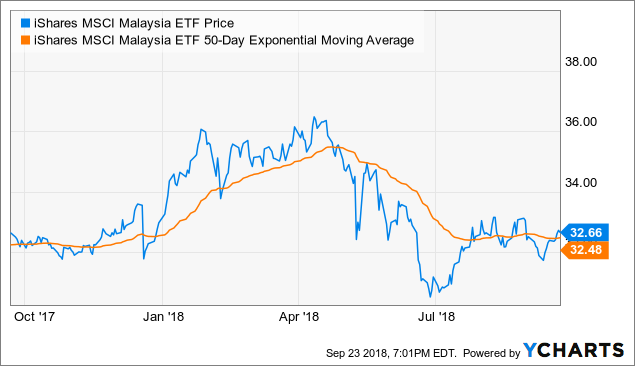
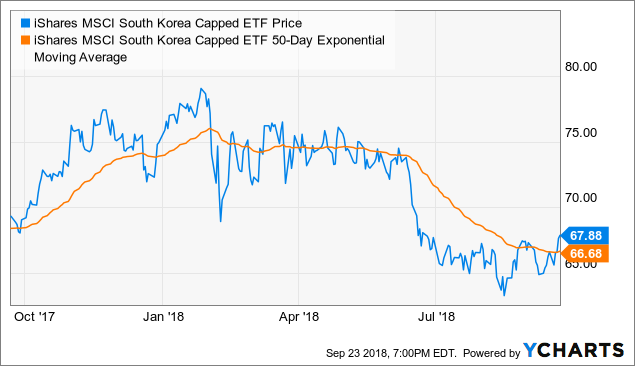
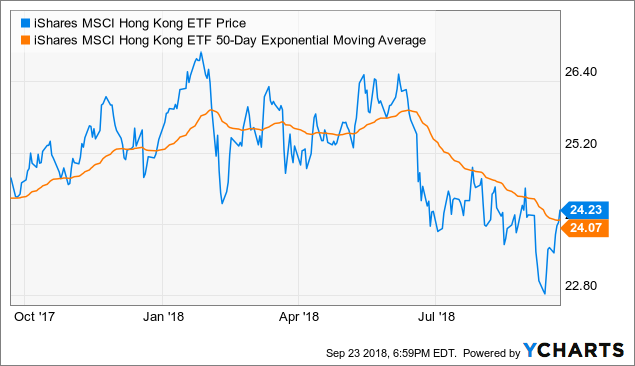
All stated iShares fund family ETF instruments have crossed their corresponding 50-day exponential moving averages in the near term.
Selection Framework
- Expense Efficiency
- Tax Efficiency
- Catalysts
- Fundamentals
- Financial Sector Exposure
- Technical Readings
The criteria list is of my own and reflects my personal expectations in relation to passive investing, particularly in the emerging market ETF space.
The ETFs analyzed are the iShares MSCI Hong Kong ETF (EWH) iShares MSCI Malaysia ETF (EWM), and lastly, the iShares MSCI South Korea Capped ETF (EWY).
The iShares exchange-traded fund family was chosen for analytical simplicity and with respect to liquidity.
ETF Comparison
| Ticker | EWH | EWY | EWM |
|
Name |
iShares MSCI Hong Kong ETF | iShares MSCI South Korea Capped ETF | iShares MSCI Malaysia ETF |
| Expense Ratio | 0.49% | 0.62% | 0.42% |
| Div. Yield TTM | 4.56% | 3.22% | 6.51% |
| P/E Ratio | 10.66 | 9.5 | 15.59 |
| Number of Holdings | 47 | 115 | 48 |
| Percentage in Top 10 | 58.93% | 47.57% | 53.55% |
| Sector Exposure |
Financials 35.06%*** Real Estate 20.27% Capital Goods 10.22% |
Technology 37.42% Financials 13.38% Consumer Disc.11.24% |
Financials 31.99% Cons. Staples 12.93% Utilities 12.33% |
Trailing 12-Month Dividend Yield Data via Seeking Alpha 9/23/2018
Let me first start off with the three stars in the Hong Kong ETF's sector exposure segment.
iShares reported Banks, Insurance, and Diversified Financials separately, resulting in real estate being EWH's top holding sector. Real estate exposure equals quality dividend yield opportunities. This allows the ETF to attract investors that normally are hesitant to purchase Emerging Market ETFs that have financials as their top exposure, such as EWM with 31.99%, according to my calculations. I find it interesting that banks, 'diversified financials' and insurance can be reported as separate sectors. I added those 3 sectors to form financials, which signifies a different top 3 sector exposure relative to the one iShares reported. Insurance, from my understanding, is a financial service.
If you prefer to divide sectors as iShares is reporting, real estate has the top exposure with 25.91%, 20.27% for insurance, and capital goods at 10.22%.
EWH provides the most significant dividend yield among the trio, although this isn't necessarily an indicator to prefer EWH over the others. It just prices the relative risk you are taking by holding the ETF. EWY is trading at 9.5x earnings and has the most technology exposure. Technology related financial instruments, whether an exchange-traded product or common equity, tend to have higher earnings multiples relative to other segments. On the contrary, EWH and EWM both have their top exposure to financials, thus a P/B comparison is more viable. EWH and EWM price-to-book readings are 1.3 and 1.62, in order.
Earnings multiples and price to book readings imply that the Malaysian ETF is the most expensive option among the three. In regards to number of holdings in each selected ETF, EWY is the most diversified option among the three. My point of view is that emerging market ETFs with minimal financials exposure are optimal. I don't think financials outside of the U.S. have attractive risk/reward profiles for U.S-based investors to allocate capital. The opportunity costs for preferring non-U.S. financials is too high from where I stand. The South Korean ETF, with the top exposure to technology, provides a better risk/reward profile along with possessing the least amount of opportunity cost. This is due to financials only making up 13.38% of EWY's composition.
Financials tend to serve as leading indicators in market movements. The highest percentage for top 10 holdings among the three is in the Hong Kong ETF, implying that the financial instrument is highly susceptible to an economic downturn, considering its financials heavy composition. A possible case for a downside scenario would be the escalation of the tariff war between the U.S. and China.
ETF Analysis
1) Expense Efficiency
Fixed management fees for ETFs serve a vital role in the selection process. Passive investors ought to consider operating expenses via the management expense ratio. This allows them to assess how much they are giving to the fund manager to operate the exchange-traded product. Those interested in the segment should seek out funds with the least management expense ratios. EWH and EWM have expense ratios of 0.42% while investors pay a higher corresponding metric for EWY, at 0.62%. For the stingy passive investor, as they should be, lower fixed management fees for South Korea exposure can be found with the Franklin FTSE South Korea ETF (FLKR). This ETF charges 0.09% for quasi-reciprocal exposure. This reflects as $62 for EWY and $9 for FLKR for a hypothetical $10,000 invested; your expenses for preferring EWY over FLKR, holding all other things constant, is $53, on a yearly basis.
FLKR is a cost efficient alternative to EWY.
2) Tax Efficiency
Exchange-traded products are subject to Form 1099, meaning that ETFs are subject to effective tax liabilities regarding the gain/loss on a yearly basis. Assuming the idiosyncratic investor has purchased an exchange-traded product in the United States, if ETF composition includes future contracts, it will be subject to K-1 taxation. Asset allocation for EWH consists of 97% common equity and 3% cash components, 99% common equity and 1% cash for EWM, while EWY consists of 98% common equity and 2% preferred stock.
EWH, EWM, and EWY are only subject to Form 1099, K-1 not required.
3) Catalyst
EWM has a serious problem that is rooted in the China-U.S. tariff war that has accelerated in the last couple months. Chief economist Manokaran Mottain, from Alliance Bank Malaysia Bhd, is worried that a full-on trade war could impact the already declining GDP growth numbers of Malaysia in the next few years. In his interview with The Star, he states the following:
A full-blown trade war between both countries could cause global trading volume and value to fall drastically. This will have bad implications on our economic growth, pulling it below the projected rate.
Malaysia’s trade volume could also fall significantly by 10% to 20% next year if the trade war worsens, although still lower than what we have seen in the aftermath of the 2009 global financial crisis.
Malaysia's exports could be severely impacted by the acceleration of the bilateral trade dispute between the U.S. and China. Goods and services made up 71.5% of aggregate exports for Malaysia in the 2017 fiscal year. The trade war is germane to the trade dependent economy of the country.
EWY saw institutional capital inflow in the recent past. Notably, Morgan Stanley (NYSE:MS) increased long exposure by roughly 2%, albeit the actual figure is 1.9413% in Q2 2018. (Morgan Stanley's EWY exposure increase calculation by author.) Another aspect I found interesting while digging around was that the top holder of EWY was the Treasury Department of Tennessee. The government organization's EWY portfolio exposure is higher than U.S. blue chips such as Amazon (NASDAQ:AMZN) and Microsoft (NASDAQ:MSFT). EWY also ranked 2nd right behind its Apple (NASDAQ:AAPL) position, with respect to aggregate holdings. On the contrary, selling came from Rehmann Capital Advisory Group. Rehmann exposure towards EWY decreased by 36.5% in Q2 2018.
The rise of protectionist policies has forced South Korea to cooperate with regional governments, such as China and Japan. In the past and recent times, these countries have differed in political aspirations. Albeit, the pressure coming from the U.S. is putting both South Korea and Japan at risk without escalating free-trade commitments with China. Multilateral relations of these countries will dictate the future of the East China Sea amid a protectionist Washington administration.
Yang Zhengwei, deputy director general of the Chinese Ministry of Commerce, stated the following at the gathering of the three countries this past Wednesday, September 19th:
As the promoters of free trade, joint efforts to push forward to build a China-Japan-South Korea FTA as well as the Regional Comprehensive Economic Partnership (RCEP) would also help to jointly resist the impact of turbulence in external markets.
South China Morning Post, Free Trade Agreement Forum, Beijing
Although the countries might seem eager to cooperate, in actuality, Japan and South Korea are not satisfied with the market barriers that the Chinese government has in place. Risk associated with EWY is formulated around the Seoul government's capability of entering the closed economy of China. China sort of has the upper hand due to South Korea's necessity to connect with the Chinese economy more deeply. A possible decline of the China-South Korea relation would limit the growth prospects for EWY. We will need to observe the upcoming free-trade agreement talks to further understand if whether the high-entry barrier to the Chinese economy will have foreign inclusion.
EWH also saw institutional capital inflow, with US Bancorp (NYSE:USB) increasing its total exposure to the fund in Q2 2018 by 110%. This act seems a little risky in my perspective considering financials make up approximately 35% of the aggregate ETF composition. I strongly advise passive investors to limit financials exposure within the exchange-traded products they purchase. If passive investors seek financials exposure, they should only consider U.S.-based financials. More on the institutional side, Wells Fargo (NYSE:WFC) decreased its exposure to the ETF by 30,984 shares in Q2 2018. Still owning over 2.1 million shares in EWH, Wells Fargo decreased its exposure by 1.4438% in the previously stated quarter. (Wells Fargo EWH exposure decrease calculation by author.)
Chinese relations with the U.S. have been on everyone's watch ever since Trump came to office with aspirations of winning in global trade. The protectionist practices have put pressure on the already decelerating growth figures of the Chinese economy. Hong Kong being the financial hub of the region could be hit hard if both regimes continue to act without regard to the dynamics of global trade. Trade barriers weigh heavily on economic growth, meaning that the already declining growth numbers of the Chinese economy could be impacted negatively as the relations of the largest two economies of the world worsen. According to CNBC, there's a 60% likelihood that all Chinese imports will be subject to tariffs, the news outlet directed the figure from Goldman Sachs.
ETF Technicals

EWM data by YCharts
From a technical basis, it is viable to wait for EWM to test the 50-day EMA. Considering the dip after crossing above the 50-day EMA, support ought to be formed before making a bullish thesis. With trade wars in mind, the ETF could continue trading in bearish territory as it has since late August. Upside from here is limited for the Malaysia ETF.

EWY data by YCharts
EWY, on the other hand, has clearly crossed over the 50-day EMA. This can be attributed to the free trade agreement talks with China, but investors should consider that the ETF has been trading below the 50-day EMA for a while now. I am expecting South Korea and China to become closer to absorb the macroeconomic downturn brought by the trade dispute. The instrument is in bearish case, although the upside is promising with the recent spike to $67.88.

EWH data by YCharts
We can see all of the selected ETFs recently moving above their respective 50-day EMA figures, but I am not as optimistic about EWH as I am for EWY.
Conclusion
Macro-driven catalysts imply that a possible decline in trade volume for Malaysia in the upcoming years could put downside pressure on EWM. The ETF has bounced back from lows dating back to around mid-June. Malaysia being reliant on exports of goods and services makes it hard to argue a bullish case in a state of trade war among the largest two economies of the world. Technical readings show that the 50-day EMA has not been able to provide sufficient support for EWM in the near past.
A bullish case is at hand for EWY and my framework deems the ETF more favorable relative to EWM and EWH. The Franklin FTSE South Korea ETF offers a lower expense ratio for those seeking to minimize ETF expenses. Limited financials exposure in the South Korea ETF serves as a plausible catalyst along with free trade agreement talks with China. Institutional capital inflow coming from Morgan Stanley is also promising.
The likelihood of all imports from China being subject to tariffs, as stated by Goldman Sachs, puts downside pressure on EWH. Institutional capital outflow from Wells Fargo, along with the ETF containing the highest financial sector exposure among the selected ETFs, concludes my bearish outlook for the Hong Kong ETF.
Due to escalating tariffs, investors should avoid EWM and EWH, while a bullish outlook is plausible for EWY, according to my relative framework.
Disclosure: I have no positions in any stocks mentioned, and no plans to initiate any positions within the next 72 hours.


