
Commodity Prices Hit Multi-Year Highs
A Nickel is worth more than a Dime

Russian’s’ invasion into Ukraine and the US (and Europe’s) sanctions coupled with a disruption of goods from Russia and Ukraine have sent commodity prices soaring. Wheat and Nickel are major exports from Ukraine and Russia.
The London Metal Exchange (LME) is considered the last bastion of pure capitalism. Open outcry for price discovery still exists there and had a bit of a hiccup this week when the price of Nickel doubled in just a few days, trapping those short and causing the exchange to cancel trades and shut down trading.
This reminds me of my days on the trading floor and the Hunt corner of silver when the Comex Exchange had to change the rules and force liquidation. It also marked the end of the historic move in metals. Will history repeat or just rhyme is the bigger question.
The price explosion in Nickel caused widespread panic throughout the world hitting hedge funds hard. In turn this caused multi billion (maybe $8 billion) losses for Tsingshan Holdings Group, a leading Chinese company.
Most Americans are already feeling the pain of rising Energy prices at the pump as the national average across the US varies but today ranges from a little over $4.00 a gallon in Texas, to approximately $4.40 in the Midwest to over $5.00 in some coastal communities (including the Northeast and Southeast) and a whopping $6.00-$7.00 a gallon in parts of California.
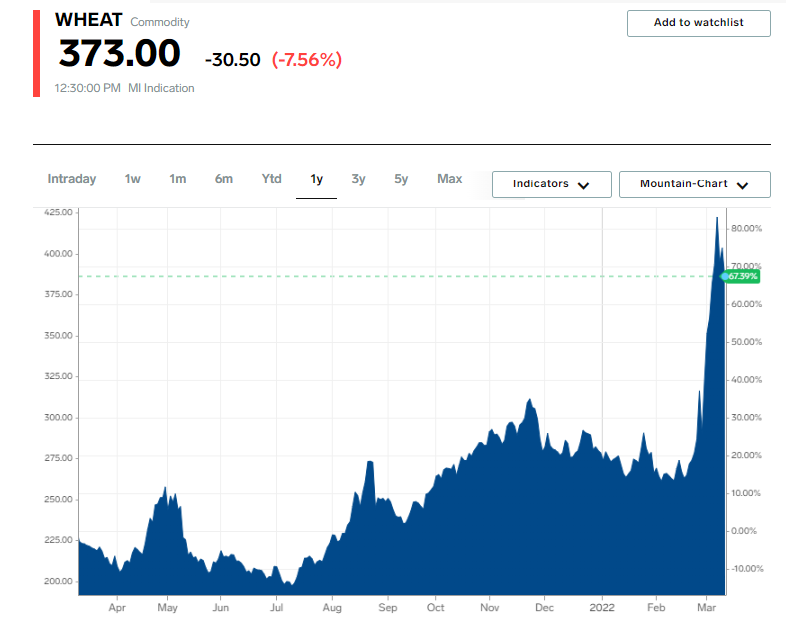
But it might surprise you that the price of Wheat has risen faster than energy prices. See chart below:

Wheat, a staple of just about every kind of food from pizza, donuts, cereal, and many household staples, has soared. This will have far reaching consequences for the huge pizza industry as the price of a pie will surely go up. From your basic Dominoes basic for less than $10 a pie to more gourmet establishments that sell pizza for $20 or more, this will have a negative and detrimental effect in the months to come. Look for no less than 20% or more increase in price for your favorite pie.
Yesterday the Federal Government reported that CPI had increased year over year at the fastest pace since the early 1980s. The annual number released was at 7.9%.
It is widely believed that the US Government is perhaps artificially deflating the real number. Given the rapid rise in energy and food prices, they don’t want the actual numbers to be put out. Most economists figure that inflation is really running somewhere in the mid-teens.
Why would the Government artificially dampen the numbers?
The Government has every reason to try and minimize the real inflation numbers. If the public really understood just how punishing these higher numbers mean there would be growing dissatisfaction and dissent with the Government. This could lead to growing consumer revolt and wreak havoc on the current administration’s goals and objectives.
Additionally many entitlement programs and government pension (social security) plans are tied to the inflation numbers and it is in the Government’s best interest to try and minimize the real cost of Food and Energy. We know this because the PPI (Producer Price Index) came out quite hot last month indicating a much higher than 7.9% rate of inflation (CPI).
Coupled with the rapid rise of energy and labor costs, food costs are climbing at an even faster rate. Here are some statistics as an example of what has occurred since February 23 when the Russians entered Ukraine:
Brent crude hit $139.13 a barrel this week, a gain of more than 40% since Feb 23 and the highest since July 2008.
Newcastle coal jumped to a record $440 a ton on Wednesday, climbing 85% since the Feb. 23 close.
Wheat prices touched a 14-year peak of $12.78-1/4 bushel this week, a gain of nearly 45% since February 23.
Corn reached $7.82-3/4 of a bushel the highest since September 2012 and a rise of 15% since Feb 23.
Aluminum (used in automobiles) prices hit a record $4,073.50 a ton this week, a 24% rise since February 23.
Nickel (used in electric vehicle batteries) surged to an all-time peak of $101.365 a ton on Tuesday up more than 300% since Feb 23 with the ferocity of the rally prompting the London Metal Exchange to halt trading.
Copper (used in housing construction) reached $10.845 a ton just above the record high of $10,747.50 not seen since May 2021.
After falling for most of the past 9 months, lumbar prices began a quick ascent and rallied back near its old highs seen last May (2021) and putting it well above $1,000 for thousand board feet. This will have a negative effect on slowing down the construction industry yet again.

What can you do to counteract these negative effects?
The current estimates for families in America range from an additional $300 per family per month to over $1,000 per family per month in additional food and energy costs. Since nobody knows how much these prices continue to go up, the estimates are wide ranging.
We have been singing the “invest in commodity stocks and ETF’s” since mid-summer last year. If you go to a few of our own Mish’s National TV Appearances last year (and even recently) she pontificated the merits of diversifying one’s portfolio and including commodity driven stocks and ETF’s.
Several of our MarketGauge portfolios have been highly concentrated in Energy, Metals and Agricultural ETF’s and we are positive and well ahead of the market year to date because of this diversification.
While many of the commodity related ETF’s’ and Stocks may have entered a “blowoff” phase or a parabolic move like Wheat above, we still think the following few steps will be helpful to mitigate your losses and/or take advantage of commodity rising prices:
- Diversify your holdings and add Oil company stocks and commodity ETF’s.
- Sell losers of companies and products vulnerable to rising energy and commodity prices.
- Add some precious metals to your portfolio.
- Consider adding some market index inverses to your portfolio.
- Raise cash.
- Become a subscriber in some of our commodity diversified strategies including ETF Complete and Mish’s Market Minute.
Here are some other observations from our Big View indicators:
Bullish/Risk On
- Despite the selloff, Clean Energy (PBW) and Solar (TAN) were each up more than +7% for the week (+)
- The McClellan Oscillator has held up better than expected for both SPY and QQQ (+/=)
Neutral
- Soft Commodities (DBA) worked off overbought conditions and closed unchanged on the week with potential flagging action indicating more upside (=)
- Gold (GLD) and Oil (USO) are also mean reverting, with Gold showing a possible island/blowoff top.(=)
- Although the market was down on the week, Volatility (VXX) closed roughly flat rather than closing at new local highs (=)
Bearish/Risk Off
- The key indices all closed negative on the week, with QQQ closing at range lows and SPY on the verge of a death-cross next week. (-)
- This is the lowest Weekly close since early 2021 for QQQ, SPY, and DIA (-)
- These are the worst weekly volume patterns we’ve seen in the key indices for quite a while, with zero accumulation days in either DIA or SPY across the past 2 weeks. (-)
- As expected, speculative sectors like Technology (XLK) -3.8% and Consumer Discretionary (XLY) -2.8% dropped, while risk-off plays like Utilities (XLU) -0.6% were down the least. The only positive sector on the week was Energy (XLE) +2.2% fueled by the war in Ukraine (-)
- Another highlight for the week is that China (FXI) got crushed. (-11.8%) and over the past 6 months (-30.7%) (-)
- The Cumulative Advance/Decline line continues to deteriorate for both SPY and QQQ (-)
- Risk Gauges remain fully risk-off (-)
- The number of stocks above three key moving averages closed well below 50% for both IWM and SPY, but are not yet at mean-reversion levels (-)
- US Long Bonds (TLT) closed at its lowest levels since early 2021, with a 3-year head and shoulders top coming closer to fruition, signaling much higher rates in the near future. (-)
- This week’s action also forced TLT to remain beneath its long term 200-day moving average (-)
- Growth Stocks (VUG) continue to lose ground against the safety of Value plays (VTV) (-)
- Regional Banks (KRE) is the only member of Mish’s Modern Family that is showing any sign of resilience right now, looking forward to a moderate rise in rates (-)
- Foreign Equities are under tremendous pressure, with (EFA) and (EEM) closing below their key 200-Week moving averages (-)
Crypto
By Holden Milstein
- Bitcoin (Bitcomp) remains range bound between $35,000 and $44,500, but is seeing continued improvement and a positive trend on both the 10/50 and 50/200 Real Motion indicators
- Terra (LUNA-X) made a new all-time high at $105.33 and looks to have the ability to keep going thanks to the ongoing success of the UST stablecoin. Followers of the CryptoPulse Quant strategy have already locked in 40% profits in WLUNA and are looking to lock in more soon
- This week’s highlight in cryptocurrency news was the Biden administration’s executive order regarding the regulation and development of the blockchain industry in the US
- It also appears like the tides have turned in the long running legal bout between the SEC and Ripple Labs (XRP-X). If Ripple Labs does in fact win the dispute, expect the price of XRP to fly.
Disclaimer: Like to learn more about relative strength methodology? Our most recent free training material can be found more


