

Image Source: Pixabay
Gas prices dropped again this week. Your son probably noticed at the pump. Mine did too.
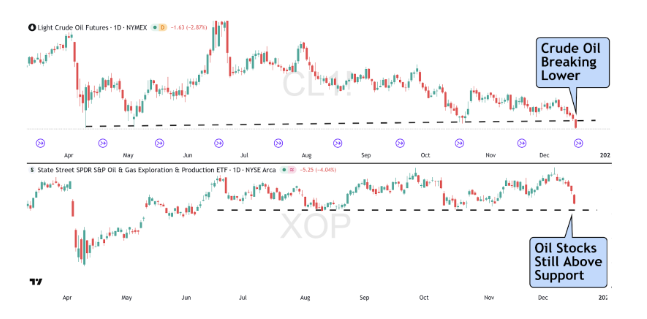
But here's what he didn't see: Oil just printed its lowest close since 2021. That's not OPEC flooding the market. That's demand falling off a cliff.
The market thinks cheap gas is a win. Smart money sees recession written in crude. You need to know how to take advantage of this.
The Real Story Behind the Selloff
Most traders attribute oil's weakness to supply dynamics. OPEC adding capacity. US shale ramping up. Standard commodity pressure.
But that overlooks a key detail: the economy may be about to stall.
This week the confusing jobs data made something clear. The employment situation is worse than it looks. When oil trades this low with job losses mounting and recession indicators flashing, you're not looking at a supply glut. You're watching economic activity contract in real time. Demand destruction doesn't show up in headlines. It shows up in price action like this.
The Energy Problem
Energy was last week's worst performer across the S&P 500. Exxon (XOM) dropped 2.15% yesterday alone. The sector already priced in the downside everyone's just now noticing.
Unfortunately, shorting oil here makes no sense. You're late. The move already happened.
But XOP—the oil and gas exploration ETF—just gave us a different setup entirely. The better opportunity is in oil exploration stocks that haven't broken down yet. Unlike crude oil, XOP has held above its support level. For now.
16,539 put contracts rolled from December into January at the $123 strike. That's not closing a bearish position. That's extending it with fresh capital and more time.
They moved from in-the-money back to out-of-the-money. They're taking profits while maintaining downside exposure.
This means that if XOP breaks $123 support, market makers will have to hedge by shorting the stock. That selling pressure will accelerate the move lower.
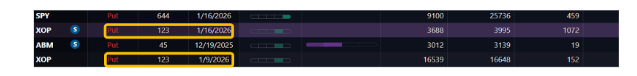
The trade structure to consider is one that captures just the beginning of this move. A vertical put spread which begins with buying the $123 put, followed by selling a lower strike put ($122 or $121) to define your risk and opportunity. You're playing the breakdown to-and-through support with a fraction of the capital required to buy puts outright.
Maximum risk is the debit you pay. Maximum profit is the width of the spread minus that debit. Simple. Defined. Structured around where institutional flow positioned before the crowd caught on.
What Happens Next
Oil at $55 used to mean $2 gas nationwide. Now it barely gets you to $2.70. That's inflation embedding itself in every layer of the supply chain.
Cheap oil isn't the relief people think it is. It's confirmation that the economy can't sustain current activity levels. OPEC cartels break down when countries need revenue. They cheat on production quotas. Supply floods the market exactly when demand craters.
Exxon's breakeven sits around $30 per barrel. Middle East producers operate at $11. The math only works one direction from here.
The XOP trade isn't betting on oil going to zero. It's positioning for normal weakness in a sector that's already rolling over. Exploration companies carry higher leverage than integrated majors like Exxon. When crude weakens, they feel it first and hardest.
That $123 level matters. Break through it and the cascade accelerates.
More By This Author:
Oil Crashes, Banks Explode Higher
The AI Lease Nobody Could Pay
Why The Stops Exist

Comments
Log in or sign up to join the conversation.