
Charts Are Showing A Discernible Shift

S&P 500 LOOKING MORE CONSTRUCTIVE
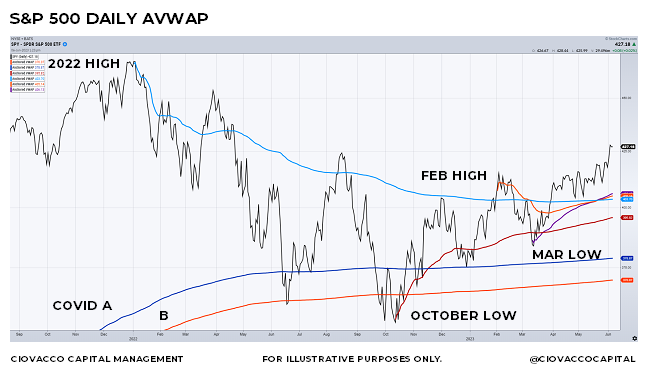
Anchored Volume Weighted Average Price (AVWAP) provides insight into areas of possible support and resistance based on the past actions of market participants. In the S&P 500 ETF (SPY) chart below, notice how the light blue AVWAP price line from the 2022 peak had a declining bias (negative slope) and acted as resistance numerous times over the past 17 months, an indication that sellers remained in control. In recent weeks, the light blue AVWAP line has flattened out and price has remained above the line, an indication buyers may be regaining control of the trend. In June and October 2022, buyers stepped in near the orange and dark blue AVWAP price lines tied to the COVID high and COVID low, a good sign for the sustainability of the stock market’s longer-term trend. Does the chart below look different from failed rally attempts in 2022?

OCTOBER 2022 UPTREND REMAINS INTACT
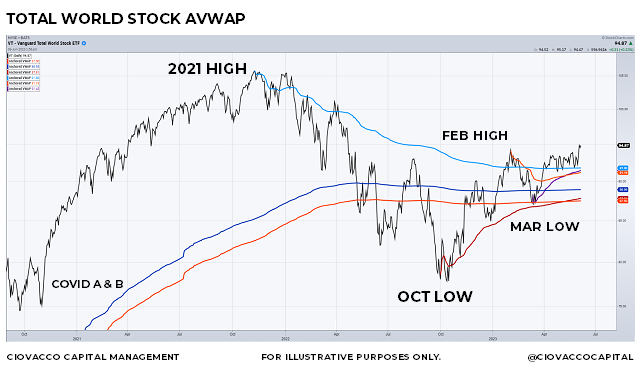
In the zoomed version of the same S&P 500 chart (below), buying conviction increased near the upward-sloping red AVWAP line tied to the October 2022 low, indicating buyers have remained in control over the past eight months. When price recaptured the orange AVWAP line tied to the February 2023 high, it indicated buyers had regained control after the 2023 countertrend move. Thus far, price has remained above the purple AVWAP line tied to the March 2023 low. The net of it all is we should respect the case for further upside in the S&P 500 as long as the present-day looks remain in place; looks that say buyers have more conviction than sellers.
IMPROVING LOOK FOR GLOBAL STOCKS
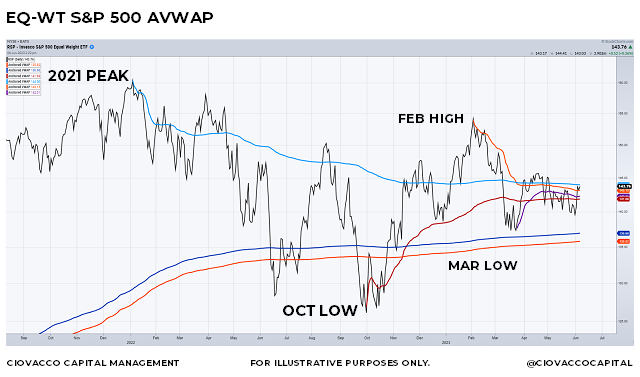
In the Total World Stock (VT) chart below, the same constructive AVWAP price characteristics apply; price has recaptured significant levels and has found buying support near logical levels indicating the trend may be flipping from down to up.

In the more detailed Total World Stock chart below, notice how price has been consolidating above the light blue AVWAP line tied to the 2021 high. Price has found buying support above the orange line tied to the February high and the purple line tied to the March low. The bearish reversal in early February 2023 looked similar to failed rallies in 2022, but since the move off the March 2023 low, the overall look of the chart is greatly improved. The June 2023 chart looks significantly different from the failed rally attempts in 2022 telling us to keep an open mind about better-than-expected economic and market outcomes in the coming months and years.
2023: A NARROW AFFAIR
At the end of May, eight of the eleven S&P 500 sectors were red YTD: energy down 11.52%, utilities down 7.22%, financials down 6.67%, health care down 5.54%, staples down 2.05%, real estate down 1.72%, and industrials down 0.98% (data from stockcharts.com). This means the Equal-Weight S&P 500 ETF (RSP) has been a major laggard YTD relative to SPY.
EQUAL-WEIGHT S&P 500: THE ONE TO WATCH
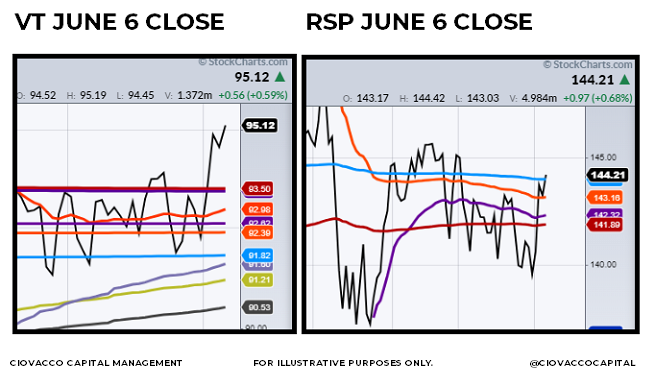
The lagging Equal-Weight S&P 500 ETF (RSP) is trying to join the leaders in terms of recapturing relevant AVWAP levels that would indicate buyers are back in control. The chart below is during the trading session on June 6.
The more detailed AVWAP charts of VT and RSP below are as of the close on June 6. These charts are very close to moving into “much more constructive” territory. RSP gained 2.39% over the past six trading sessions, including the 0.68% gain on June 6. If RSP can continue to morph into a look similar to VT (left) and SPY, it would be a big plus for the current stock market rally. Conversely, a reversal below the relevant AVWAP lines would add to the concerning side of the weight-of-the-evidence ledger.
MARKET INTERPRETATION VS. PERSONAL INTERPRETATION
The market sets asset prices. More specifically, it is the net aggregate interpretation of all market participants regarding all fundamental subjects on all timeframes that determines if the market is trending higher, moving sideways, or trending lower. There is a big difference between the market’s interpretation and our personal interpretation or opinion. Common sense tells us our personal opinion does not drive the stock market. Thus, if we want to monitor the odds of good things happening relative to the odds of bad things happening, we should try to understand the message from the market. The current message tells us to remain open to better-than-expected economic, earnings, and market outcomes.
WILD CARD: INFLATION
Inflation remains well above the Fed’s target, which means while the Fed may pause in June, future rate hikes cannot be ruled out. If the Fed keeps hiking, the economic impact could lead to job losses, curtailed spending, lower corporate profits, and a recession. This bearish scenario is currently not supported by the market charts, nor the fundamentals, but must be respected as long as inflation remains elevated.
SPEAKS TO LONGER-TERM OUTLOOK
Even if the stock market produces better-than-expected outcomes between now and the end of 2023, it does not remove normal-and-to-be-expected volatility from the equation. The concepts presented above are best utilized in a weight of the evidence approach. Topics covered recently are also relevant parts of the risk-reward equation:
-
Weekly trend vs. history
-
S&P 500 sector health
-
Message from stock/bond ratio
-
S&P 500 multiple timeframe trends
More By This Author:
History Of Recessions And Impact On Today's Stock Market
Do The Charts Align With An Imminent-Recession Narrative?
Are Stocks Set Up For A Sharp Reversal?
Disclosure: This post contains the current opinions of the author but not necessarily those of Ciovacco Capital Management. The opinions are subject to change without notice. This article is ...
more

