A Short-Term Downtrend Or A Market Rest?

Image Source: Pixabay
The short-term downtrend looks set to continue. The PMO index is showing that the majority of stocks have lost their upwards price momentum and have either pulled back in price or are trading sideways. It seems likely by the end of next week that the PMO will be near the bottom of its range, which is where I start to consider which stocks to hold in larger concentrated positions.
The PMO index may be indicating stock market weakness, but the major indexes have been holding up well and are trading sideways rather than moving lower. Basically, when the market tried to rally this past week, the sellers stepped in, and when the market tried to sell off, the buyers stepped in.
Last Saturday, it looked like the bullish percents were pointing decisively lower, but they have mostly moved sideways since then. In other words, this so-called short-term downtrend has been more of a market rest or consolidation of the gains so far rather than a pullback in prices.
It wouldn't be an update without a look at this chart of the junk bond ETF. The price broke below the support level, but it attracted buyers at the uptrend line. So far, this looks to me like the price behavior you would expect during a short-term downtrend that is actually a pause within a larger uptrend. Weeks or months from now, a break above the 95-level would be particularly bullish for the general market.
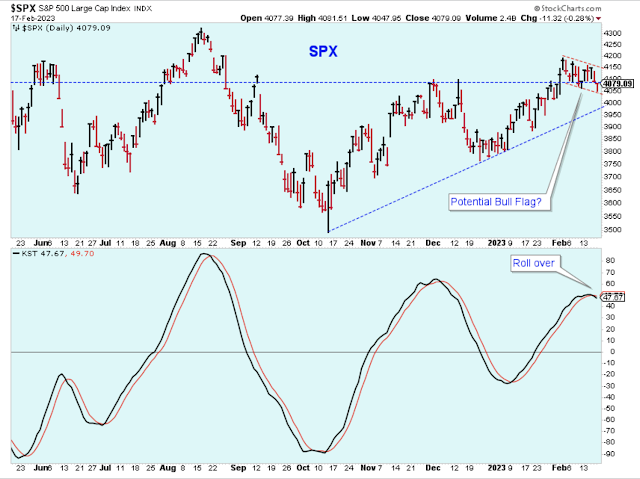
There are times when a short-term downtrend is very slow to get started but then picks up speed to the downside quickly, and we have to be ready for the possibility. It may be that instead of a sideways consolidation, we may be experiencing a slow topping process for a larger downtrend. I mention this because it is a little unsettling to see this momentum indicator for the SPX starting to move over just now. It seems late.
The market often picks up downward momentum along with rising volatility as it nears the bottom of a short-term cycle, so don't let down your guard by getting overly confident. One way to know that downside momentum has begun would be to see a break down below this potential bull flag price formation.
The NYSE new 52-week lows continued to behave quite well, and that is a major bullish signal for stocks. The top panel of this chart is bullish for stock prices. The Nasdaq new 52-week lows have picked up a bit and present a note of caution, although you would expect more new lows among the weaker group of stocks during a short-term downtrend.
The price of WTIC continues to top near the 90-level. What to make of this? Keeping this price below 90 is probably critical for healthy consumer spending, but it also caps the price of most energy stocks.
While the price of this commodity continues to move between 70 and 90, I interpret it as bullish for the general stock market.
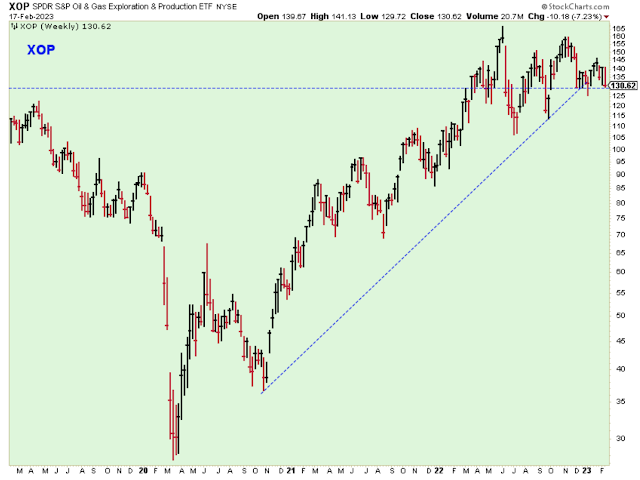
I don't like energy stocks and haven't for some time. This chart looks like a top formation to me.
I went short European stocks a couple weeks ago based on this chart. The short hasn't worked so far and I have covered, but I haven't given up. The price of this ETF is just under significant resistance.
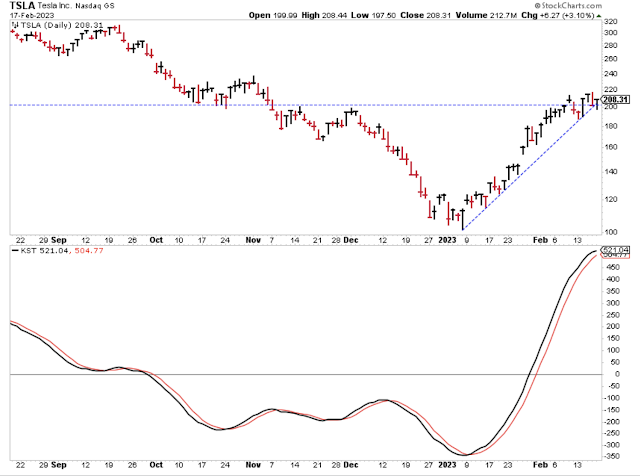
Tesla continues to be one the more important stocks to watch while monitoring the health of the general market. While this stock remains in an uptrend, I think the entire market will benefit and follow higher, too. That KST really looks extended.
Bottom Line
I'm about 25% short and 55% long. The shorts are inverse ETFs of the major indexes, and the longs are positions in the stocks that have a combination of the best fundamentals and bullish chart patterns. I remain a bear, although I acknowledge that the market has been healthy so far this year and that the indicators favor being long stocks at the moment.
The ECRI index has traveled all the way from extreme lows in October to just under the zero-level. That is a healthy move that shows excellent improvement, although I still regard any reading under zero to suggest an economic recession.
If the index gets up above zero, then I will be watching for opportunities to hold stocks for longer than just the short-term cycle. And if the index gets above the 2-level, then I'll switch to a process where I also buy 3x leveraged long ETFs in addition to individual stocks.
Outlook Summary
- The short-term trend is down for stock prices as of Feb. 9.
- The economy is at risk of recession as of March 2022.
- The medium-term trend is uncertain for Treasury bond prices as of Feb. 4.
More By This Author:
A New Short-Term Downtrend Began On ThursdayThe Short-Term Uptrend Continues With More Upside To Come
A Shift In Focus
Disclaimer: I am not a registered investment adviser. My comments reflect my view of the market, and what I am doing with my accounts. The analysis is not a recommendation to buy, sell, ...
more


