
A Recovery Is Shaping Up
Those hoping for a “V”-shaped recovery from the March stock market nadir have nearly realized their dream. The S&P 500’s rebound has been a bit a more ragged than its descent--it’s taken twice as long for the index to get within reach of its February high--but it’s been a remarkably exuberant revival.
(Click on image to enlarge)
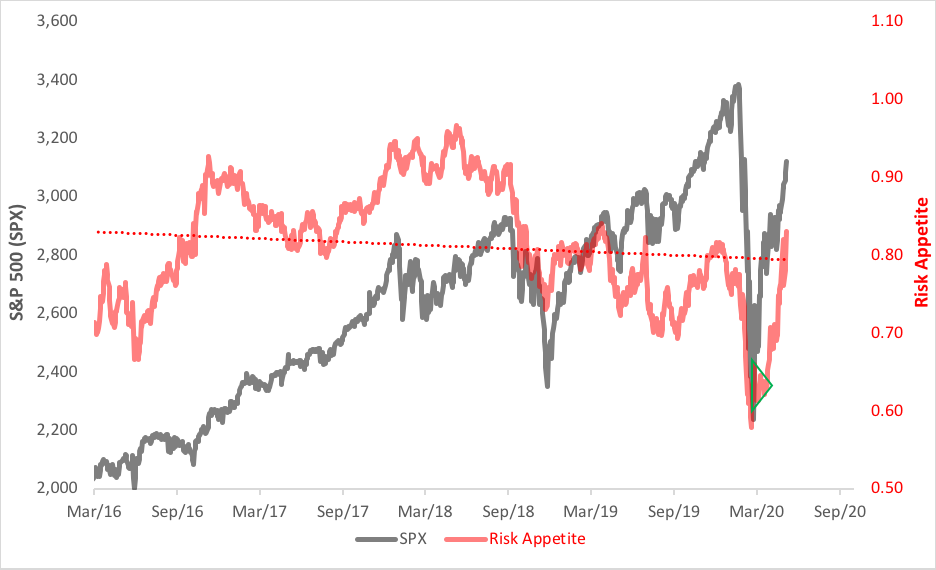
Perhaps too exuberant. That could be reasonably inferred, anyway, from that stalwart barometer of investor sentiment, the XLY/XLP ratio. You probably know the ratio by now. It’s the quotient derived from dividing the price of the Consumer Discretionary Select Sector SPDR (XLY) by that of the Consumer Staples Select Sector SPDR (XLP).
XLY owns all those companies that make or supply the things you’d like to have--such as General Motors (NYSE: GM), Tiffany & Co. (TIF), and Royal Caribbean Cruises Ltd (RCL)--while XLP’s outfits provide the goods and service you must have. When you think of XLP, think Procter & Gamble Co. (PG), Kroger Co. (KR), or Clorox Co. (CLX).
The XLY/XLP ratio rises as confidence in the economy flourishes and slumps as faith in future prosperity dwindles. It tends to move ahead of the broad market indices, so it has predictive value. Recently, the ratio’s been turbocharged--on the way up and on the way down. You can see this in the chart below.
(Click on image to enlarge)
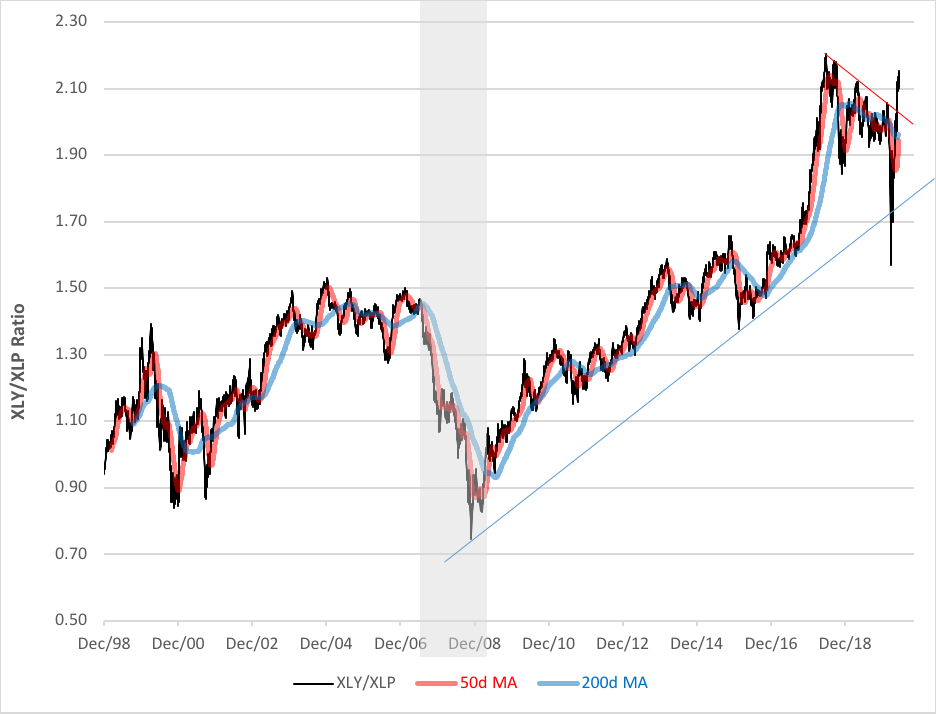
The ratio’s been a roller coaster for nearly three years. It peaked in mid-2018 after an eight-month climb and ultimately broke its decade-long uptrend line when the COVID outbreak reached U.S. shores. Now the ratio’s above its pre-virus level and seems intent on challenging its all-time high.
Such precipitous moves often prove to be disappointments for traders, though. They tend to be overshoots. Realistically, some backfilling should be expected before a new high is scored. That red downslope line on the chart may very well get tested as support for the ratio.
A “golden cross” would certainly help. That means the ratio’s 50-day moving average crossing to the upside of its 200-day metric. Right now, the two averages are separated by only a couple of basis points. A crossover is a distinct possibility.
More good tidings come from the intraday chart. There seems to be a cup-and-handle pattern forming. That’s a bullish configuration that, if realized, points to an objective of 2.23 for the ratio which finished at 2.15 Thursday.
On the fixed-income side, the picture’s clearer. Long rates have been ratcheting up recently, knocking the stuffing out of bond and bond ETF prices. In the past month, the nominal yield on the 30-year Treasury bond has risen by 32 basis points. That’s taken a toll on the iShares 20+ Year Treasury Bond ETF (TLT). In the past month, the fund has lost 4.4%. The fund’s monthly standard deviation has been 3.6% over the past three years, so this is a noteworthy loss.
(Click on image to enlarge)
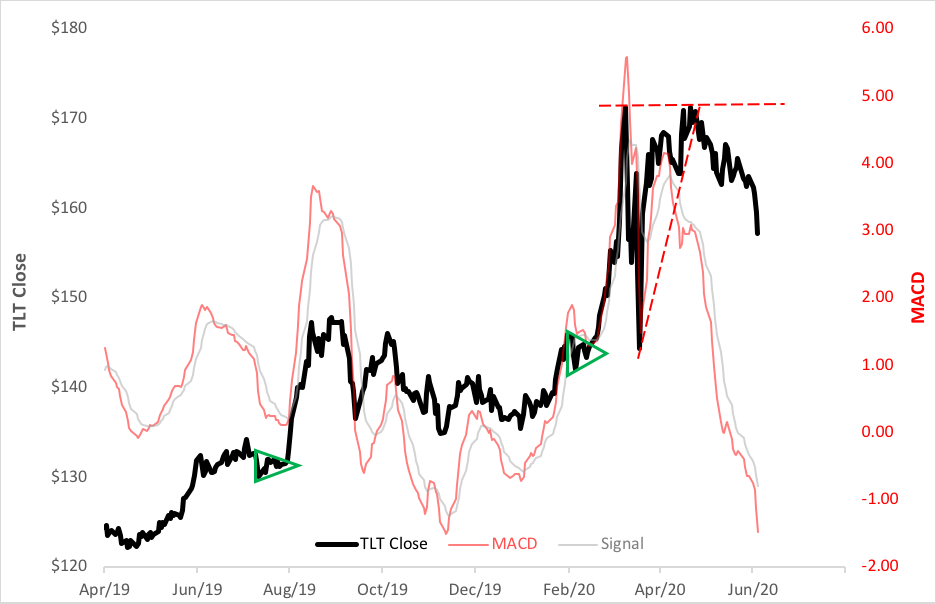
TLT’s weekly chart showstopping action pointing to an objective near $150. That’s another 6% of downside. Below that is a longer-term target near $144.
Traders looking to capitalize on the near-term weakness in bonds could use the ProShares UltraShort 20+ Year Treasury ETF (TBT) which offers -200% daily exposure to the same ICE U.S. Treasury 20+ Year Bond Index tracked by TLT. Technically, the ProShares fund has the momentum to carry it 14% higher. Given the compounding effect embedded in leveraged investments like TBT, traders should use TLT’s price action as a selling guide. Lifting a TBT position when the iShares fund hits its near-term target and reassessing the technical picture may be the smartest approach. If further bond weakness is detected, a new TBT position could then be established.
Last week was definitely a “risk on” party for equity players. For bond investors, liquidation prevailed. Is this regime sustainable? For the near term, momentum certainly favors the risk gambit. Caution is the watchword for longer-term strategies.
Disclosure: None.

Comments
 No Thumbs up yet!

