
2022 marked a full year of rate hikes, unprecedented since the Global Financial Crisis, which propelled short-term yields upward and in turn ultimately caused the 10-2 spread1 to fall below zero in the second half of 2022, where it has since stayed. Recent market expectations suggest that the end of rate rises is perhaps in sight as we start to see its impact on a few U.S. regional banks as well as the forced takeover of one of Europe’s largest banks—Credit Suisse—earlier this year. While the latest U.S. inflation numbers have eased, employment data continues to suggest a strong labor market. It’s anyone’s guess whether the Fed will move rates in June.
Index Performance
Let us take a look at the performance of key USD indices in 2022, and 2023 YTD. Thereafter, we will explore how the index performance may have impacted ETFs flows in their respective categories so far this year.
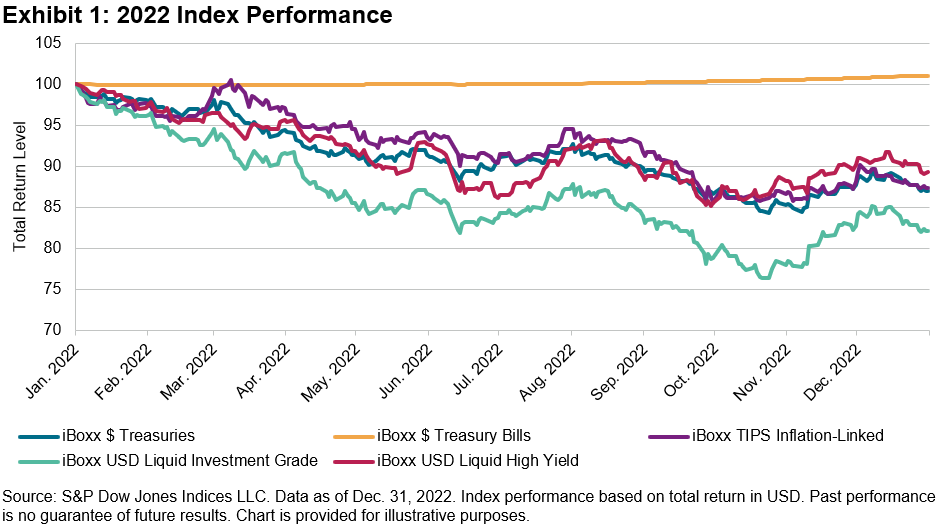
As can be seen in the chart above, 2022 was a pretty dismal year for USD fixed income, with the multiple rate hikes depressing the value of bonds, especially the longer tenors. The only index that was not adversely affected by the interest rate movements was the short-dated iBoxx $ Treasury Bills, which measures the performance of U.S. government bills with maturities of one year or less.
The worst-performing segment was high quality corporate bonds, as represented by the iBoxx USD Liquid Investment Grade. The index was down 17.9% in 2022.
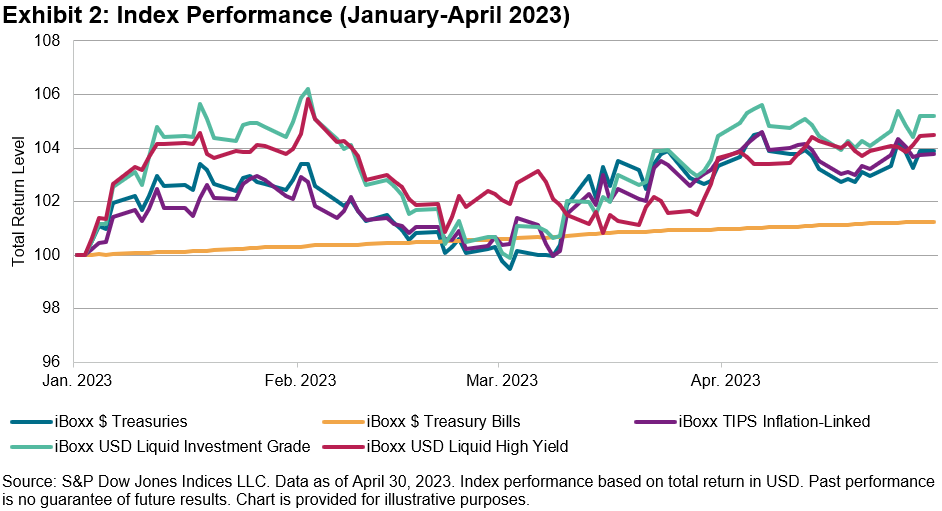
It has been a completely different story since the start of 2023; all of these featured indices are back in the black, led by the iBoxx USD Liquid Investment Grade with a YTD return of 5.2% (as of April 30, 2023), outperforming short-term treasury bills and other U.S. government securities.
The positive performance coincided with market sentiment that we may be nearing the end of the rate hikes, which may have prompted investors to start moving away from short-term bonds into longer-tenure bonds with an emphasis on credit quality.
ETF Flows
As depicted in Exhibit 3, investors have seemingly begun to move away from inflation and money market products this year, with the majority of the flows moving into U.S. government bonds. Even though corporate investment grade bonds performed better than U.S. Treasuries (as seen in Exhibit 2), investors may still be cautious of the overall economic outlook and thus prefer the safe haven of a relatively risk-free asset over corporate investment grade bonds.
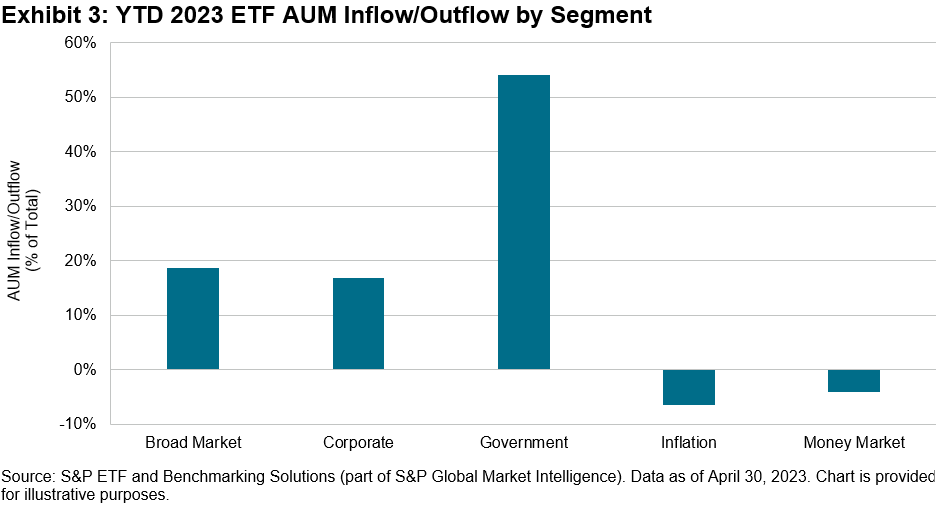
As of April 30, 2023, U.S. Treasuries—as represented by the iBoxx $ Treasuries—offered a yield of 3.73% with an annual modified duration of 6.35 years, while U.S. investment grade bonds—as represented by the iBoxx $ Liquid Investment Grade—offered a yield of 5.17% with an annual modified duration of 8.36 years.
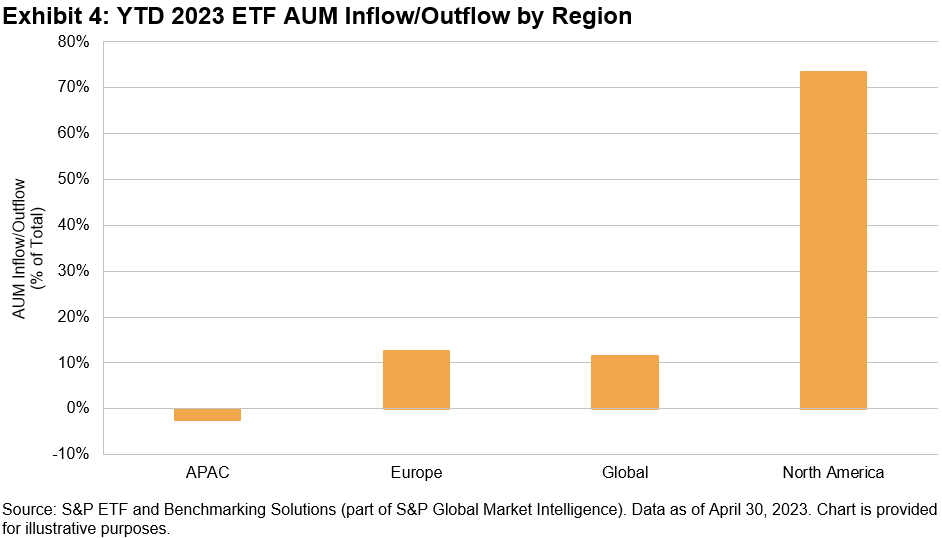
It is perhaps of no surprise that the majority of the AUM flows were directed into U.S. fixed income ETFs, given their dominance and market share in the overall ETF market. There has also been a small outflow from APAC ETFs so far this year, perhaps due to the preference for high quality bonds and higher yields in offshore markets compared to lower local currency yields in certain APAC markets.
Short- or Longer-Term Investments Today?
In a hypothetical scenario, if one were to invest in a longer-term bond fund today and rates retreat over the next couple of years, the return on investment may be higher than the “offered yield” today due to capital appreciation of the bonds. This is due to the inverse relationship between bond prices and yields (as yields go down, bond prices go up).
As we may be approaching the end of the rate hikes, will we see a sustained shift toward medium-to-long dated bonds in the near future?
1 Source: Federal Reserve Bank of St. Louis
More By This Author:
Combining Sectors And Sustainability
The S&P GSCI Cooled In April As Inflation Cooled
Equal Weighting Within Sectors: Impact And Potential Applications


Comments
Log in or sign up to join the conversation.