

Image Source: Pixabay
I believe that a new short-term downtrend started on Friday, Aug. 19. Many of the short-term indicators that I follow have turned lower, indicating a new short-term downtrend, however there are still some important indicators that aren't yet confirming the downtrend, such as the PMO index shown below.
So, I think it is definitely time to protect profits made from the short-term uptrend that started in June, but if you plan to short stocks in order to profit from the downtrend, then you have be careful to limit losses in case the market decides it isn't done with the rally and heads higher again.

All three of the major indexes closed below their 5-day averages. This chart doesn't indicate a short-term decline just because the indexes are below their 5-day averages, but it is a requirement of a new short-term downtrend for the indexes to close below their 5-day lines.

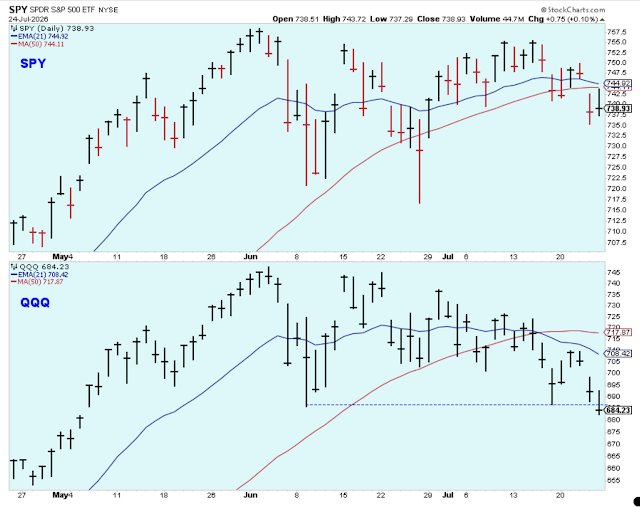
Here is a look at the same chart style and the same indexes, but with the 5-day averages replaced by 200-day averages. The indexes found resistance and turned lower at the longer-term lines, but they still maintain prices above their May highs which is now support.
If the indexes break down below the May highs, then they will signal confirmation of the downtrend. However, a pullback in prices is expected at important long-term resistance, so you have to keep a balanced view. The bears will be looking for a sharp break below the May highs on strong volume, and the bulls will be looking for a dull series of ticks lower on light summer volume.

Here is another look at the same thing. The SPX was rejected at resistance and broke below its steep uptrend line. This is not the most convincing trend line break that I have ever seen, but considering how short-term overbought the market is at the moment, I'm thinking it signals the next turn lower. And, as mentioned above, not only is the market overbought, it has also rallied up to an important resistance level where it turned lower.
I like to review this chart because it so nicely shows how the peaks and troughs of the short-term cycle correspond with the peaks and troughs of the PMO index. In other words, the two panels in this chart are two ways of showing the same thing.

The bullish percents turned lower and are pointing downwards, although again these are not a sharp reversals like the ones you can see in mid-June. So far, this chart only suggest a brief time-out for stocks.

Apple broke its uptrend line, but not by a lot, and again it isn't convincing. This stock could so easily reverse higher early next week on some positive news, but for now all I can see here in this chart is a stock ready to at least pause and work off its overbought indicator before moving higher again.

The number of new 52-week lows increased on both exchanges to levels that indicate selling. These aren't alarming levels of new lows, but they are high enough to support the idea of the next short-term downtrend.

I'm a stock market bear, and maybe I am seeing what I want to see in the charts, which is that a new short-term downtrend has started. However, even a market bull would agree that prices don't go straight up, and that a pause in the advance at this point makes sense.
Bottom Line: I did not participate much in the most recent market rally off the June lows, but what profits I did make have now been mostly captured by partial and outright sales. Some of the cash has already been deployed into short positions, and I will put on more shorts if the PMO index turns lower early next week.
I'll also be quick to cover the shorts if the market, and particularly Apple, look like they are going to resume their uptrend. I have a large short position in Europe and the US small-caps, and I added a short of the SPX on Friday. If the short-term downtrend confirms, then I will probably build a large short position in the emerging markets because the US dollar has rallied so sharply in the last few days.
So, with the short-term trend out of the way, there is a bigger and more important question about the longer-term trend. Does the strength of the recent short-term uptrend signal that the bear market is over, and the lows are in for the major indexes? My view is that we are still in a bear market and that this was a counter-trend rally off way too oversold levels.
My opinion is that the market rallied when people had sold so much stock and raised so much cash that it was burning a hole in their pockets, while at the same time they were seeing stocks like Netflix and Paypal sell off to unimaginable levels well below the early 2020 lows of the pandemic. So they started picking up these great companies at huge bargains, and other people started to follow in as they saw the stocks rally and they didn't want to miss out.
And this buying led to important technical buy signals as stocks broke out above resistance levels, which in turn brought in the institutions as their technical algorithms triggered. Now, the buying is a bit exhausted and people are wondering what to do next, so out of caution there is partial profit-taking as investor hesitation starts to set in.
So, you probably expect me to say something like, now the market will prove me right by resuming to the downside. But, the thing is, if I said that, it would just be a lot of sour grapes from someone who didn't profit from a great opportunity. I think the people who got this right were the ones who said, this is a great opportunity and I'm gonna make money from it and not fight the trend.
I think that is the key: not to fight the trend. I won't say for anyone else, but that's the right way for me to play this game. However, don't worry about me. I'm not too down on myself because I know that I don't always get it right in the stock market, and if I miss one rally there is always another one later where I can prove to myself that I can do this and play the game well.
Outlook Summary
- The short-term trend is down for stock prices as of Aug. 19.
- The economy is at risk of recession as of March 2022.
- The medium-term trend is uncertain for treasury bond prices as of Aug. 13.
More By This Author:
Still In A Short-Term UptrendThe Short-Term Uptrend Continues After Upside Acceleration
It Is Time To Prepare For The Next Short-Term Downtrend


Comments
Log in or sign up to join the conversation.