

Image Source: Pexels
The SPY just touched new highs. Everyone's celebrating.
Pull up the holdings breakdown. The top 10 stocks represent 38% of total assets.
Thirty-eight percent. That's not diversification. That's concentration risk dressed up as an index fund.
When this corrects, and it will correct, that concentration amplifies every percentage point of decline. You're not spreading risk across 500 companies. You're betting the majority of your capital on 10 names.
I teach applied portfolio management at Loyola. Making money isn't about being a homegrown hero looking for the next 10-bagger.
It's about rearranging risk. Rearranging correlations. Rearranging weightings of positions.
You do it forever. I've been doing this 38 years. It's the only way to pyramid wealth without blowing up accounts.
Today, I'm teaching you the actual framework for evaluating portfolio diversification. Not just buying different ETFs and hoping. Real methodology for identifying when alternatives provide protection versus when they just add more correlated exposure.
Here's the checklist and why most alternatives fail the test right now.
The Five-Point Checklist for Real Diversification
Let me walk you through Japan's EWJ as the teaching example. This shows you exactly what to evaluate when looking at any alternative to SPY concentration.
First question: What's the concentration level? EWJ's top 10 holdings make up 28% of the fund.
That's 10 percentage points less than SPY. Better, but still meaningful concentration.
Second question: What sectors drive it? Mitsubishi Financial leads. Then Toyota. Then Sony.
Two industrials and one financial. The sector breakdown shows 23% industrials and 17% financials. That's genuine sector diversification away from tech domination.
Third question: Can you actually trade it? Net assets sit at 15 billion. Daily volume runs 189 million shares.
The liquidity works. You won't get stuck in wide spreads or slippage.
Fourth question: What's the valuation differential? The fundamental metrics show cheaper multiples than SPY across price-to-sales and price-to-book.
Different economic drivers. Different sector exposure. Lower concentration. Solid liquidity. Reasonable valuations.
Everything checks the boxes. This looks like exactly what you need to reduce SPY concentration risk.
Except for question five.
Why Correlation Destroys Every Other Advantage
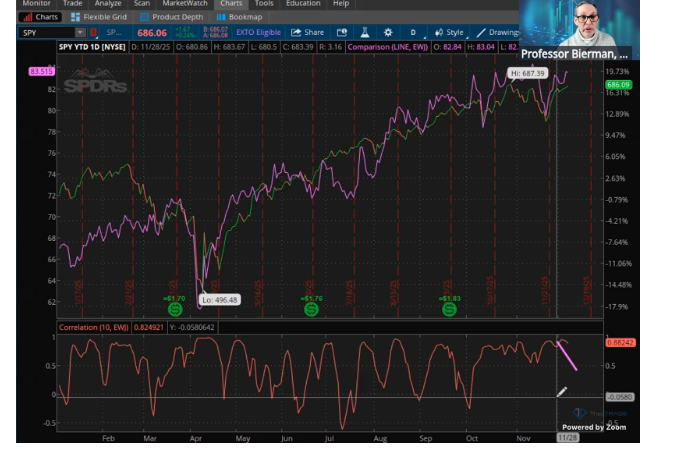
Fifth question: What's the correlation to SPY? The number is 0.88.
That one metric invalidates every advantage I just listed.
At 0.88 correlation, EWJ moves in the same direction as SPY 88% of the time. When SPY falls 5%, EWJ likely falls 4-5% right alongside it.
You think you're diversified because you own different sectors in different countries. You're not. You own two products that fall together.
Here's the paradox that proves correlation matters more than fundamentals. Japan raised interest rates all year. We cut rates for the better part of the year.
Opposite monetary policy. Identical price action.
That tells you everything. The fundamental drivers don't matter when global liquidity flows dominate. Everything moves together because capital allocation follows the same systematic patterns regardless of regional policy.
Look at Brazil's EWZ for the same lesson. Top holdings are Nu Financial at 12% and Vale Materials at 9.9%.
Energy. Materials. Financials. Zero technology exposure. The PE ratio sits at 11 versus SPY's 29.
The standard deviation runs 23% versus SPY's 18%. Higher volatility creates potential hedge value because asymmetric moves can offset SPY declines.
Different sectors. Cheaper valuation. Higher volatility. Everything suggests it solves the concentration problem.
The correlation sits at 0.88. Same as Japan. Both alternatives move in lockstep with US markets despite completely different fundamental makeups.
That's the lesson. Correlation trumps every other factor when evaluating diversification benefit.
What Actually Breaks Correlations
You need correlation below 0.5 for genuine diversification. Ideally you want negative correlation where one goes up while the other goes down.
That creates true portfolio protection. Your gains in one position offset losses in another.
So what breaks these correlation patterns? Three conditions create decoupling.
Regional crises that impact one market independently. When Japan's specific economic issues drive their market while US markets operate on different factors.
Commodity shocks that benefit materials exporters like Brazil while pressuring US tech valuations. Energy price spikes help EWZ while hurting SPY.
Monetary policy divergence that actually matters rather than just existing on paper. When rate differentials create genuine capital flows between regions instead of everything following US liquidity patterns.
None of these conditions exist right now. Global markets move together on US monetary policy and liquidity injection.
That's why 0.88 correlations persist despite fundamental differences in sector exposure, valuation levels, and regional policy.
When the SPY corrects 10-15% early next year, watch what happens to these correlations. If Japan or Brazil decouple and move independently, that's when diversification value emerges.
If EWJ falls only 5-6% while SPY drops 10%, you've found protection. If EWZ falls 12-13% because commodity exposure amplifies the decline, you've found a hedge opportunity to short against long SPY positions.
But right now at 0.88 correlation, adding either position just gives you more exposure that falls together. That's not diversification. That's accumulation of correlated risk.
The Timing Framework That Actually Matters
This brings me to the core lesson about portfolio construction. Asset quality matters far less than correlation timing.
Japan offers better sector diversification than SPY. Brazil offers exposure to hard assets and commodities. Both have solid liquidity and reasonable valuations.
None of that matters at 0.88 correlation. The best alternative asset becomes worthless for diversification when it moves in lockstep with your existing positions.
Your job isn't finding the perfect alternative. Your job is identifying when correlation patterns break and timing creates genuine diversification benefit.
Track correlation factors on any alternative you consider. Monitor when regional factors or sector-specific moves create independent price action.
Watch for corrections that stress correlations and force decoupling. That's when SPY concentration becomes the risk you can actually diversify away.
When SPY corrects and alternatives decouple, you'll either be positioned ahead or stuck with 38% concentration amplifying every point of decline.
The framework I just taught you works for any alternative. Sector funds. Regional ETFs. Commodity exposure. Even individual stocks.
Check concentration. Verify sector mix. Confirm liquidity. Compare valuations. Then measure correlation.
That fifth question determines whether everything else matters. Without correlation analysis, you're just buying more of the same risk in different wrappers.
More By This Author:
We Just Missed A 90% Probability EventTech Stocks Are Now Their Own Sectors
Why We Have 28 Days Before Markets Nosedive

Comments
Log in or sign up to join the conversation.