
Crude Oil Heading For $75
Clear patterns provide opportunities for decent returns. On our Crude weekly chart below, Crude has made an inverse Head & Shoulder Pattern at the bottom and crude is running in the tight zone for sometime now.
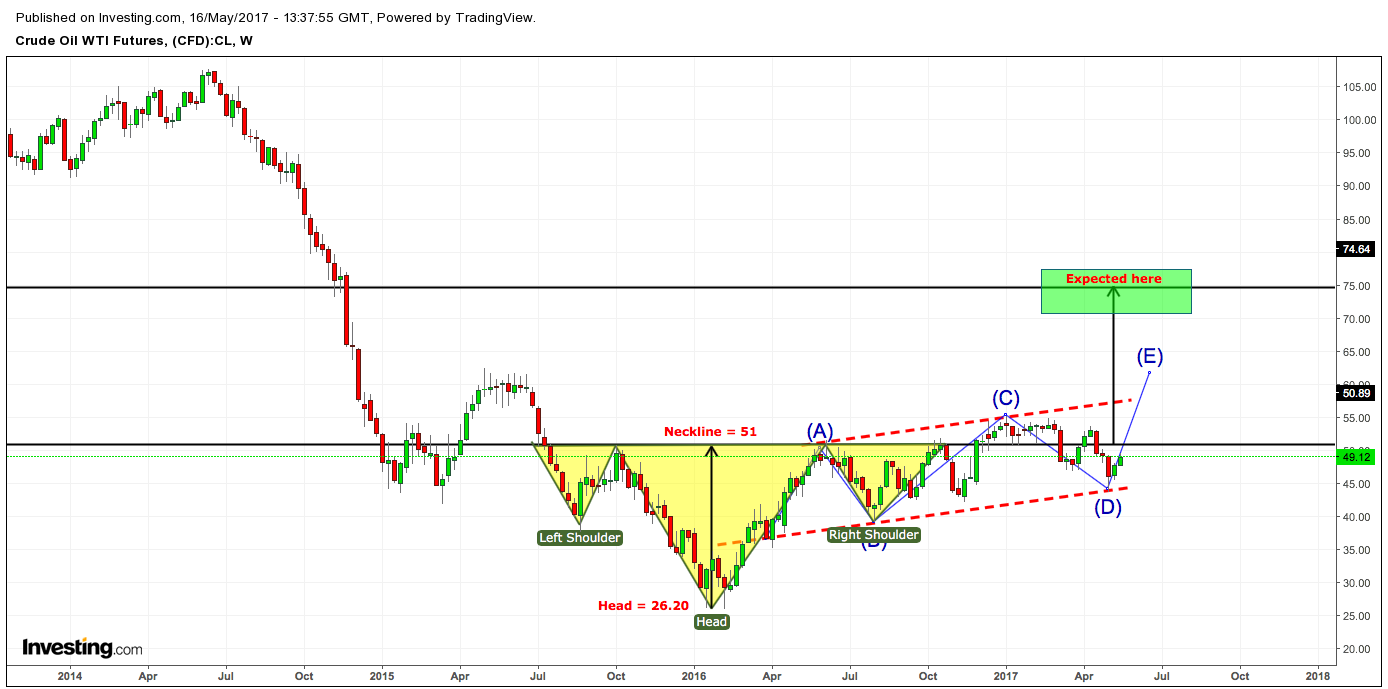
Crude has completed its 4th wave inside the channel and has now started its 5th wave which can take the price to $57 though an inverse Head & Shoulder pattern. The target comes out to be $75. One more important thing to learn here is that price is making higher highs (HH) and hiigher lows (HL) giving a bullish trend signal.
Monthly chart - After a decent run from year 2004 to 2008, crude prices have gone in to a descending triangle & started its 5th Wave inside the descending triangle.
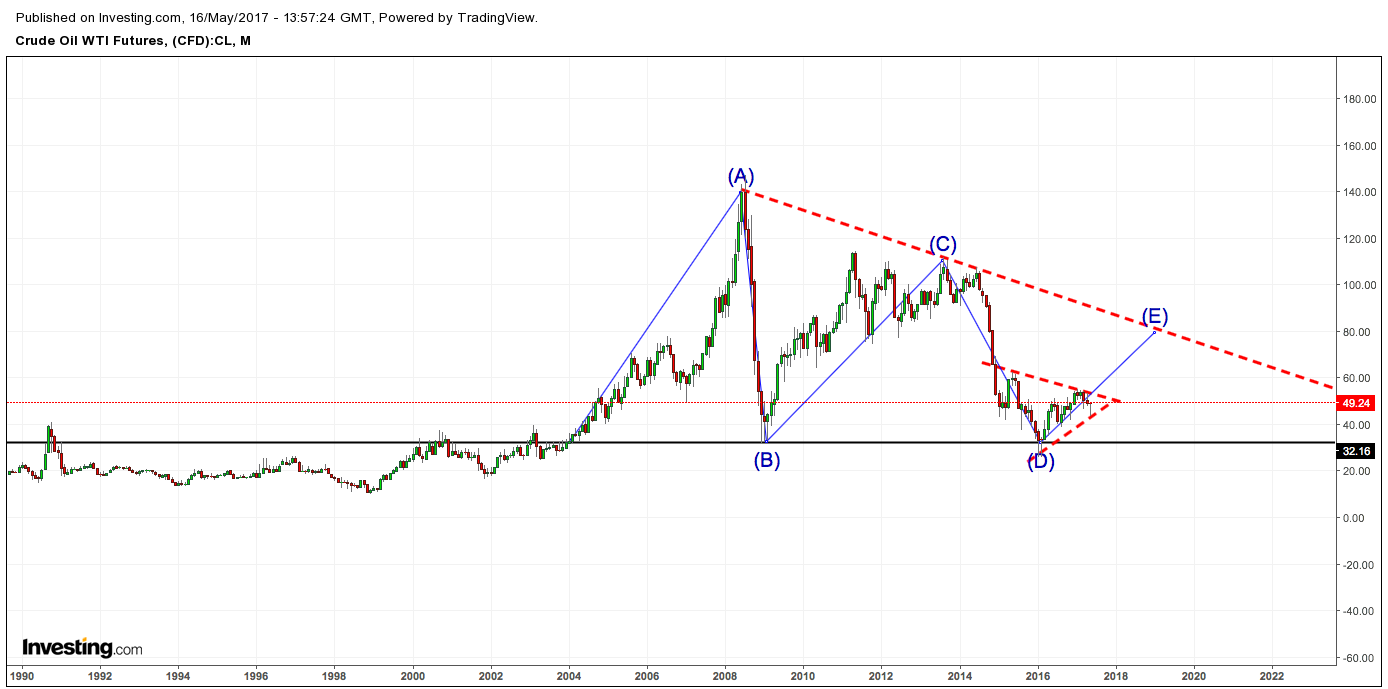
So after looking at the monthly and weekly charts, one can target $70-$75 or initiate an options strategy which will reward you with promising returns.
Disclaimer: The above views are only for educational purposes. Equity & commodity trading has large potential rewards, but also large potential risks. You must be aware of these risks and be ...
more


Crude Hit 64.7$ :) Buy was given at around 49$ on 16.05.2017 :)