
Employment Market Appears To Be Softening

Image Source: Pixabay
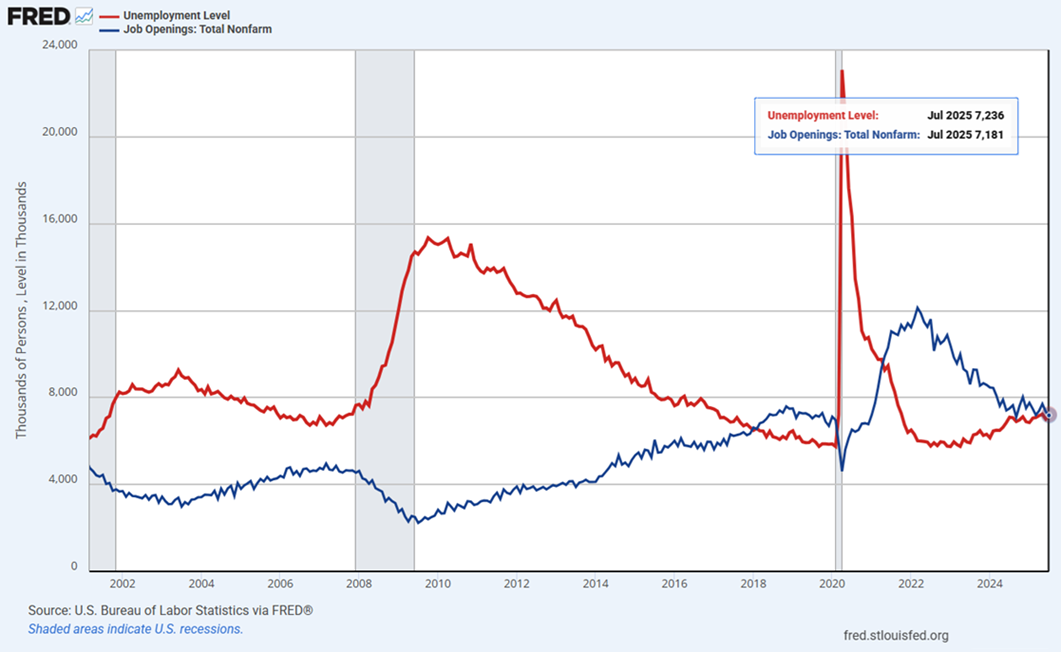
Today's release of the Job Openings and Labor Turnover Survey (JOLTS) provided additional insight that suggests the employment market is weakening. The report shows Job Openings of 7.18 million are now lower than the number of unemployed individuals, or 7.24 million. The last occurrence where the job openings level fell below the number of unemployed was during the Covid recession in 2020.
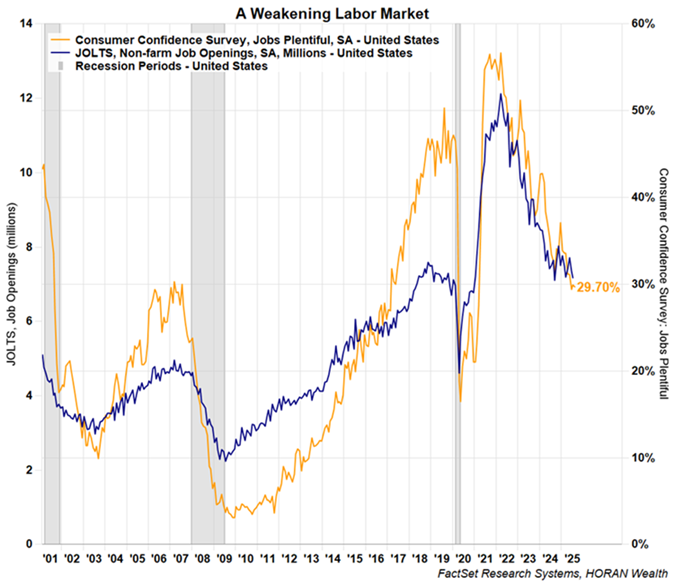
In the Conference Board's Consumer Confidence Survey reported last week, 29.7% of consumers indicated jobs were "plentiful," down almost 2 points from July. This view by consumers has been in steady decline since its peak in March 2022 at 56.7% and coincides with the decline in job openings.
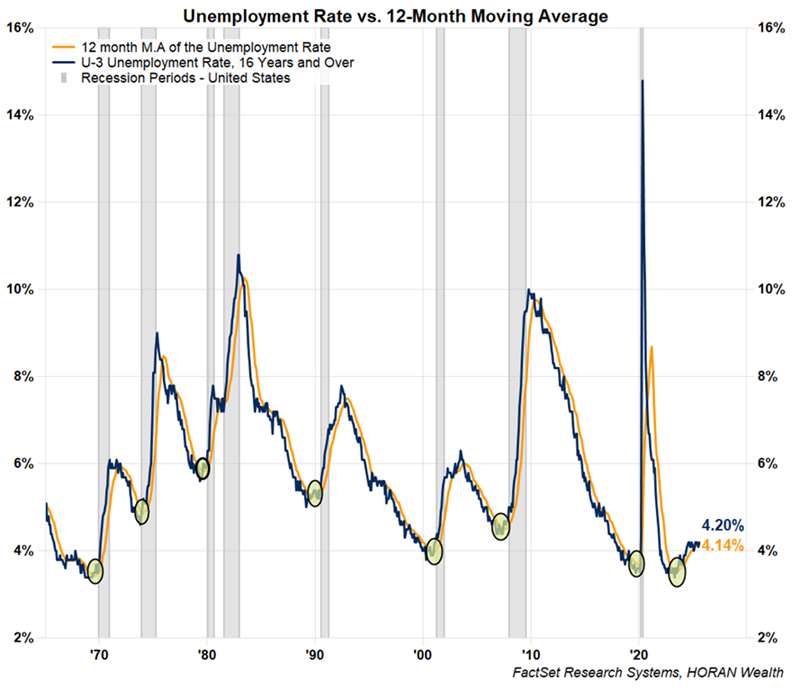
Lastly, the unemployment rate in July was reported at 4.2% and has mostly trended higher at a level above the 12-month moving average of the rate since early 2023. The yellow circles in the chart below note prior instances where the monthly rate rose above the 12-month moving average. Historically, these crossover points have occurred prior to recessions, the grey shading on the chart.
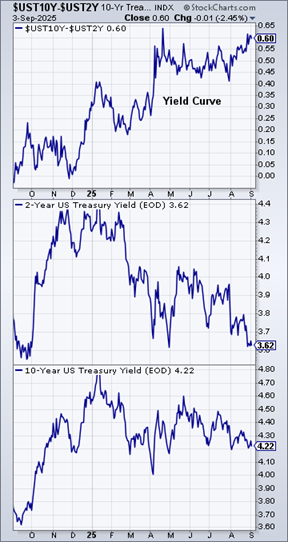
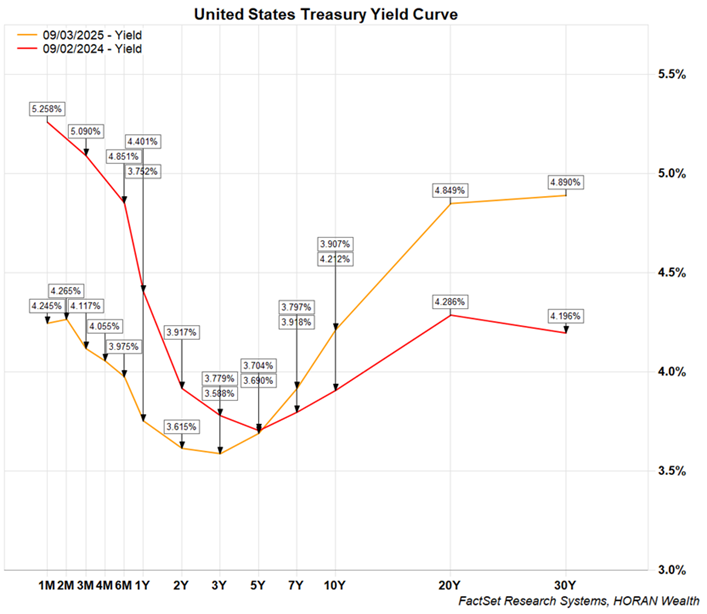
The consumer part of the economy accounts for approximately 70% of GDP. With this apparent weakening in the job market, it might be just enough information that the Fed uses to justify a quarter-point rate cut later this month. The bond market is coming around to this view as well, as short-term rates continue to decline. Long-term rates are falling at a slower pace, though, and longer-term rates are above the levels from a year ago, i.e., the yield curve is steepening. This steepening of the yield curve is some indication that the market expects inflation to be an issue as the Fed is cutting short-term rates. Alternatively, where short-term rates are falling faster than long-term rates, known as a bull steepener, this can be a bullish indication for stocks and the economy.
More By This Author:
S&P 500 Index Buybacks Hit RecordDogs Of The Dow Performance Ahead Of The MAG 7 Return
Bonds In A Portfolio Making More Sense
Disclaimer: The information and content should not be construed as a recommendation to invest or trade in any type of security. Neither the information nor any opinion expressed constitutes a ...
more

