Elliott Wave Technical: Vechain / U.S. Dollar
Photo by Wance Paleri on Unsplash
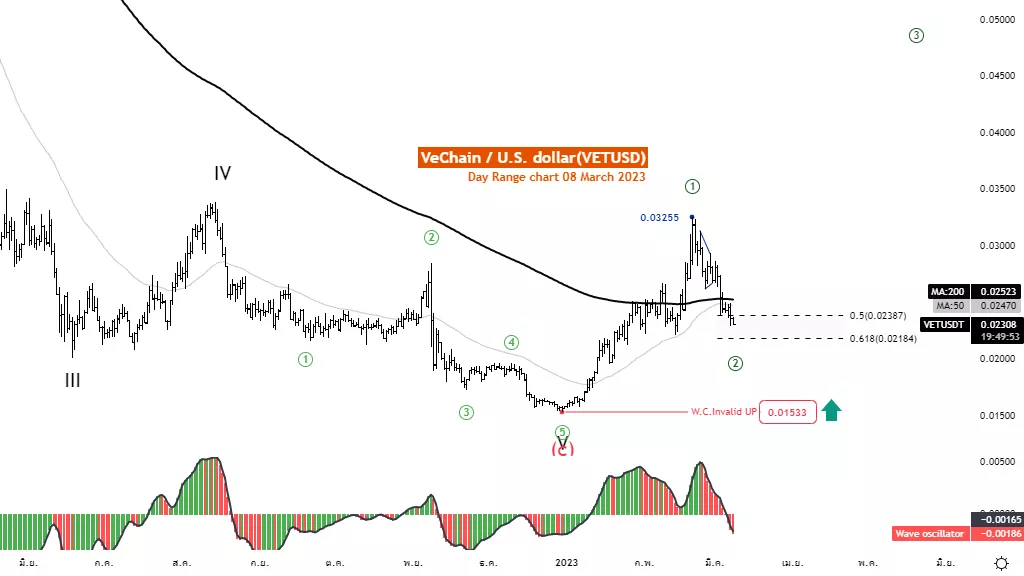
Elliott Wave Analysis Trading Lounge Daily Chart, 08 March 2023.
Vechain / U.S. Dollar (VETUSD)
VETUSD Elliott Wave Technical Analysis
Function: Counter trend
Mode: Corrective
Structure: Zigzag
Position: Wave (C)
Direction Next higher Degrees: wave ((2)) of Impulse
Wave Cancel invalid Level: 0.01533
Details: : Retracement of wave ((2)) usually .50 or .618 x Length wave ((1)) at 0.218.
Vechain / U.S. Dollar (VETUSD)Trading Strategy: Vechain recovered from the level of 0.01533 and ended at the level of 0.03255 with a wave pattern. Causing us to expect an increase in the first child And the price is reversing in the second wave. And must not retrace below 0.01533, wait for the second wave to complete to join the trend again cond wave to finish to join the trend again.
Vechain / U.S. Dollar (VETUSD)Technical Indicators: The price is below the MA200 indicating a downtrend. The wave oscillators below Zero-Line momentum are bearish.
Analyst: Kittiampon Somboonsod

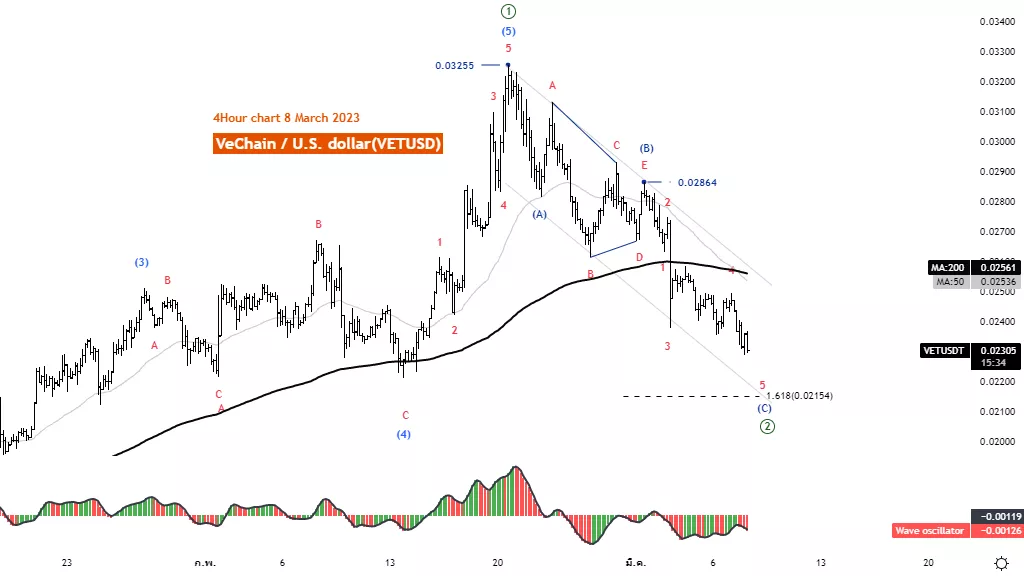
Elliott Wave Analysis TradingLounge 4H Chart, 08 March 2023.
Vechain / U.S. Dollar (VETUSD)
VETUSD Elliott Wave Technical Analysis
Function: Counter trend
Mode: Corrective
Structure: Zigzag
Position: Wave (C)
Direction Next higher Degrees: wave ((2)) of Impulse
Wave Cancel invalid Level: 0.01533
Details: Wave (A) is usually equal to 1.618 multiplied Length of wave (C) at 0.02154.
Vechain / U.S. Dollar (VETUSD) Trading Strategy: Vechain recovered from the level of 0.01533 and ended at the level of 0.03255 with a wave pattern. Causing us to expect an increase in the first child And the price is reversing in the second wave. And must not retrace below 0.01533, wait for the second wave to complete to join the trend again cond wave to finish to join the trend again.
Vechain / U.S. Dollar (VETUSD) Technical Indicators: The price is below the MA200 indicating a downtrend. The wave oscillators below Zero-Line momentum are bearish.

More By This Author:
Elliott Wave Technical Analysis: U.S. Stocks
Elliott Wave Technical Analysis: Intercontinental Exchange Inc.
Elliott Wave Technical Analysis: Bitcoin/US Dollar, Tuesday, March 7
Disclosure: As with any trading or investment opportunity there is a risk of making losses especially in day trading or investments that Trading Lounge expresses opinions on. Note: Historical ...
more


