Elliott Wave Technical Analysis: TRX/USD Crypto Price News Today
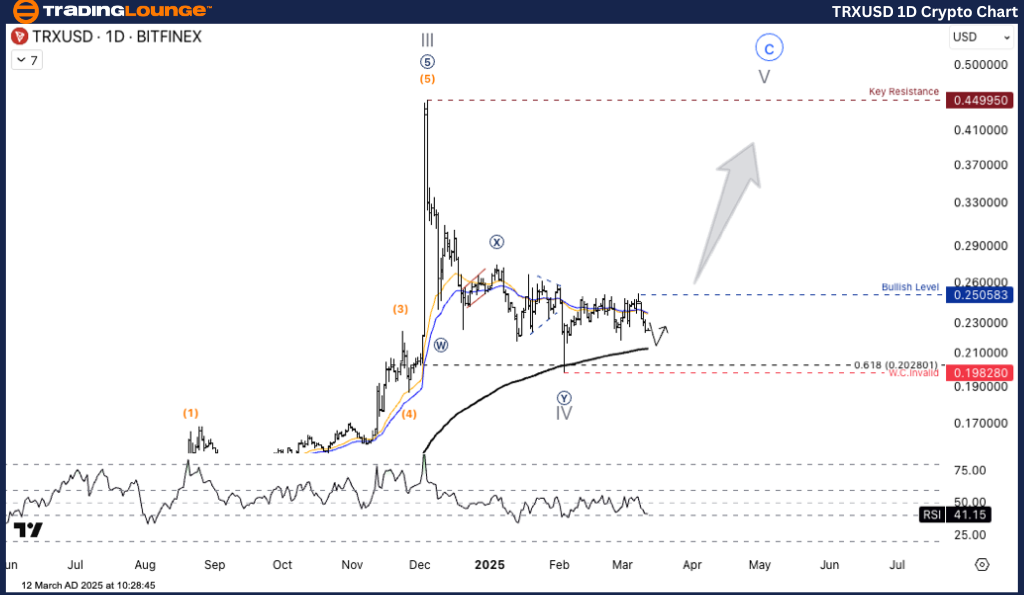
Elliott Wave Analysis - TradingLounge Daily Chart
TRX/USD (TRXUSD)
TRXUSD Elliott Wave Technical Analysis
- Function: Counter Trend
- Mode: Corrective
- Structure: Double Corrective
- Position: Wave ((Y))
- Next Higher Degree Direction: Wave IV of Impulse
- Wave Cancellation Level: Not specified
Details:
The price is currently in Wave IV (Cycle Degree) following the completion of Wave III. If the price remains above this level, there is a strong likelihood of initiating an uptrend in Wave V.
TRX/USD (TRXUSD) Trading Strategy
The market is positioned in Wave IV (Cycle Degree) after marking the peak of Wave III. Currently, the price is moving within a consolidation phase, either in Wave (X) or (Y). If the price holds at this level, an uptrend towards Wave V is probable. However, if the price drops below $0.198, further correction to lower zones may occur.
Trading Strategies
- Long Strategy
- Buy when the price pulls back to the key support level (Pullback Entry).
- Wait for a confirmed reversal signal at the support level before entering.
- Buy when the price pulls back to the key support level (Pullback Entry).
- Risk Management
- If the price falls below $0.198, the bullish structure is invalidated.

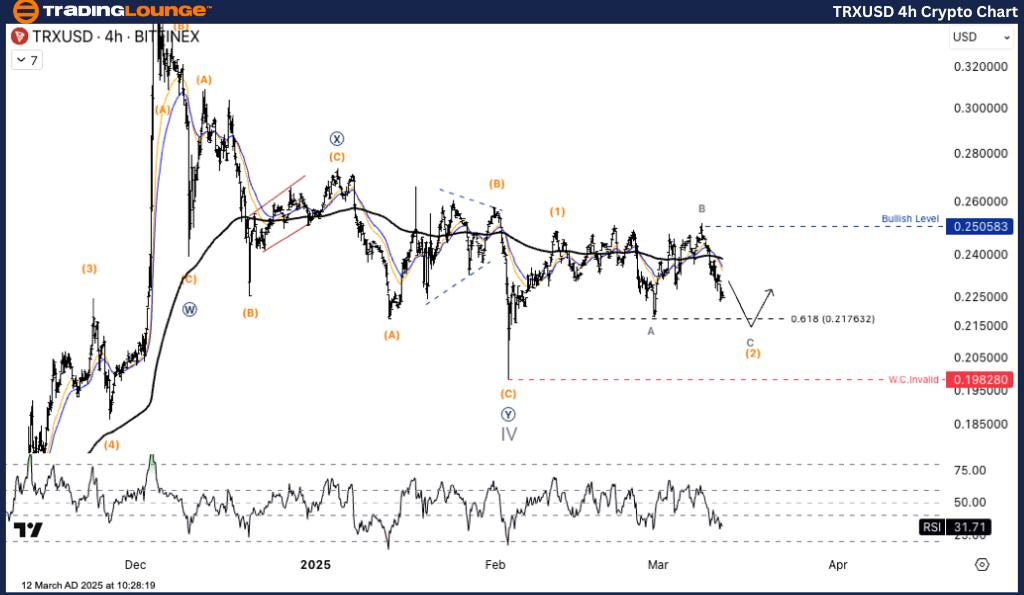
Elliott Wave Analysis - TradingLounge H4 Chart
TRX/USD (TRXUSD)
TRXUSD Elliott Wave Technical Analysis
- Function: Counter Trend
- Mode: Corrective
- Structure: Flat
- Position: Wave C
- Next Higher Degree Direction: Wave (2) of Impulse
- Wave Cancellation Level: Not specified
Details:
TRX/USD is currently positioned in a potential reversal zone within the Wave (3) structure.
TRX/USD (TRXUSD) Trading Strategy
The price is in Wave (2), forming an ABC correction. The key support level is Fibonacci 0.618 ($0.2176), which could serve as a reversal point. If the price stays above this level, the potential for an uptrend toward Wave (3) increases.
Trading Strategies
- Long Strategy
- Buy when the price dips to the key support level (Pullback Entry).
- Wait for a confirmation signal of reversal at support before entering.
- Buy when the price dips to the key support level (Pullback Entry).
- Risk Management
- If the price falls below $0.198, the bullish structure is invalidated.

TradingLounge Analyst: Kittiampon Somboonsod, CEWA
More By This Author:
IShares Bitcoin Trust ETF – Elliott Wave Technical Analysis
Elliott Wave Technical Analysis: Fisher & Paykel Healthcare Corporation Limited
Elliott Wave Technical Analysis: Texas Instruments Inc. - Tuesday, March 11
At TradingLounge™, we provide actionable Elliott Wave analysis across over 200 markets. Access live chat rooms, advanced AI & algorithmic charting tools, and curated trade ...
more


