

Image Source: Pixabay
Elliott Wave Analysis – TradingLounge Daily Chart
SOLANA/ U.S. Dollar (SOLUSD)
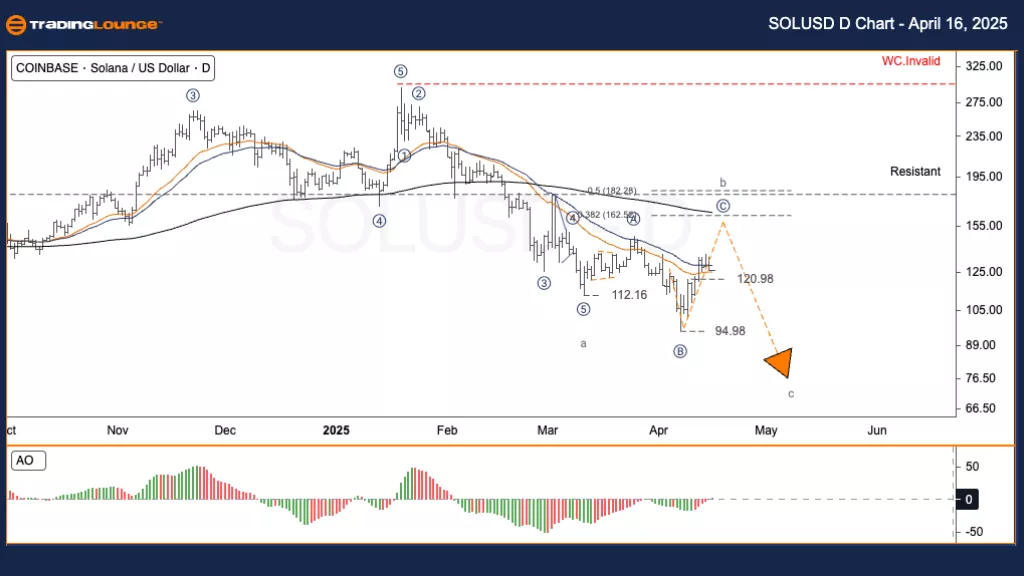
SOLUSD Elliott Wave Technical Analysis
Function: Counter-trend
Mode: Corrective
Structure: Flat
Position: Wave B
Next Direction (Higher Degree):
Invalidation Level:
SOLANA/ U.S. Dollar (SOLUSD) Trading Strategy
The current SOLUSD (Solana) chart reveals an unfinished consolidation. Analyzing the wave patterns suggests that Wave C of the ABC corrective structure is still unfolding. The highs between $210 and $215, observed in early 2025, likely signaled the conclusion of the larger Impulse Wave (Wave V). Since then, the market has moved downward with weakening momentum. Wave a completed near $112.16, followed by a modest bounce in Wave b. Currently, Wave c is progressing.
Trading Strategies
Strategy
Approach
✅ For short-term traders (Swing Trade)
Watch for a bearish reversal signal near the $130 level.
If the price fails to hold and gets rejected at the Fibonacci resistance, consider initiating a short position.
Place a stop loss just above $135 for protection.
Risk Management
Elliott Wave Analysis – TradingLounge H4 Chart
SOLANA/ U.S. Dollar (SOLUSD)
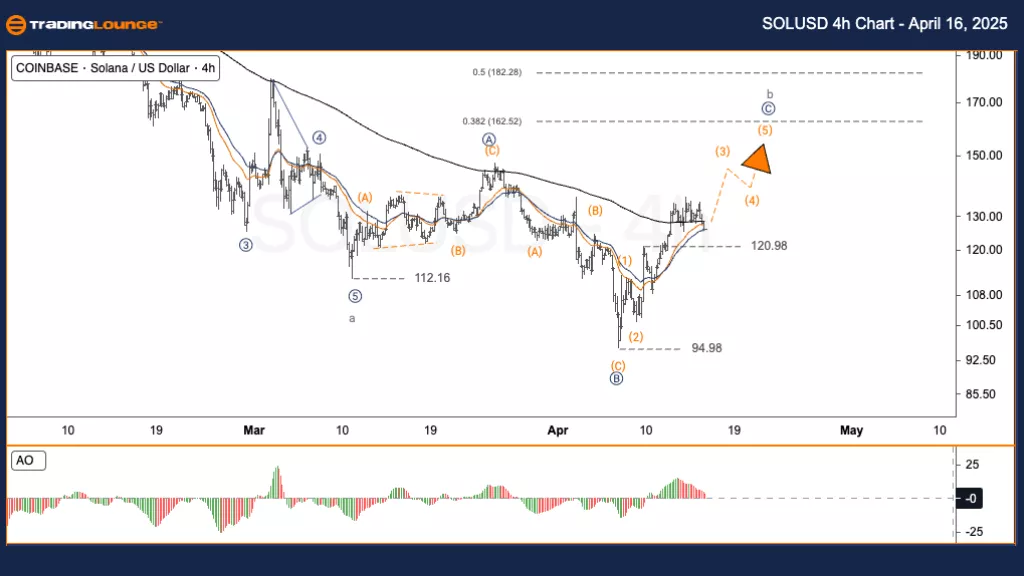
SOLUSD Elliott Wave Technical Analysis
Function: Counter-trend
Mode: Corrective
Structure: Flat
Position: Wave B
Next Direction (Higher Degree):
Invalidation Level:
SOLANA/ U.S. Dollar (SOLUSD) Trading Strategy
The current chart of SOLUSD (Solana) still reflects an incomplete consolidation phase. Wave C in the ABC formation hasn’t yet played out fully. Earlier in 2025, the price peaked between $210–$215, likely ending the major Impulse Wave (Wave V). Since that peak, price action has shown a downward trend with reduced strength. Wave a ended at approximately $112.16, then a brief retracement formed Wave b. Now, Wave c is active and developing.
Trading Strategies
Strategy
Approach
✅ For short-term traders (Swing Trade)
Look out for a bearish reversal pattern near the $130 resistance level.
If the price shows rejection at the Fibonacci zone, a short position may be suitable.
Use a stop loss placed above $135.
Risk Management
TradingLounge Analyst: Kittiampon Somboonsod, CEWA
Visit Tradinglounge.com
More By This Author:
Unlocking ASX Trading Success: Amcor Plc - Tuesday, April 15
Elliott Wave Technical Analysis: Fortinet Inc. - Tuesday, April 15
Elliott Wave Technical Analysis: New Zealand Dollar/U.S. Dollar - Tuesday, April 15


Comments
Log in or sign up to join the conversation.