


Photo by Executium on Unsplash
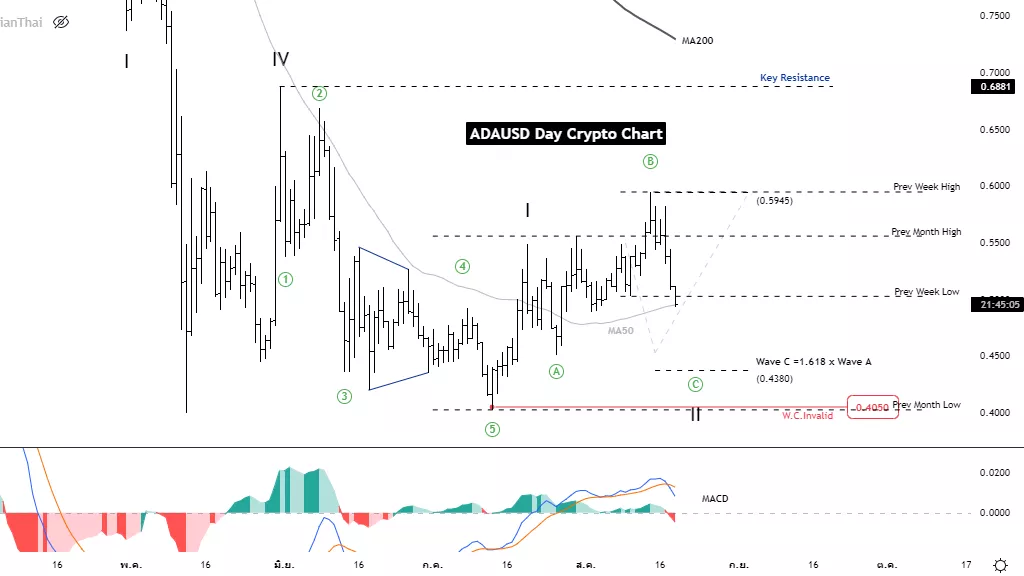
Elliott Wave Analysis TradingLounge Daily Chart, 19 August 2022, Cardano(ADAUSD)
ADAUSD Elliott Wave Technical Analysis
Function: Counter trend
Mode: Corrective
Structure: Flat
Position: Wave ((C))
Direction Next higher Degrees: Wave II of Motive
Details: corrective Expanded Flat In wave two, wave ((c)) is usual y 1.618 x wave ((A)).
Wave Cancel invalid Level: 0.4050
Cardano(ADAUSD) Trading Strategy: As this is a short correction to the uptrend so we should take the opportunity when the second wave is finished to join the trend again.
Cardano(ADAUSD) Technical Indicators: MACD crosses the signal line above the zero line. It may be a short-term reversal.
Analyst: Kittiampon Somboonsod
(Click on image to enlarge)
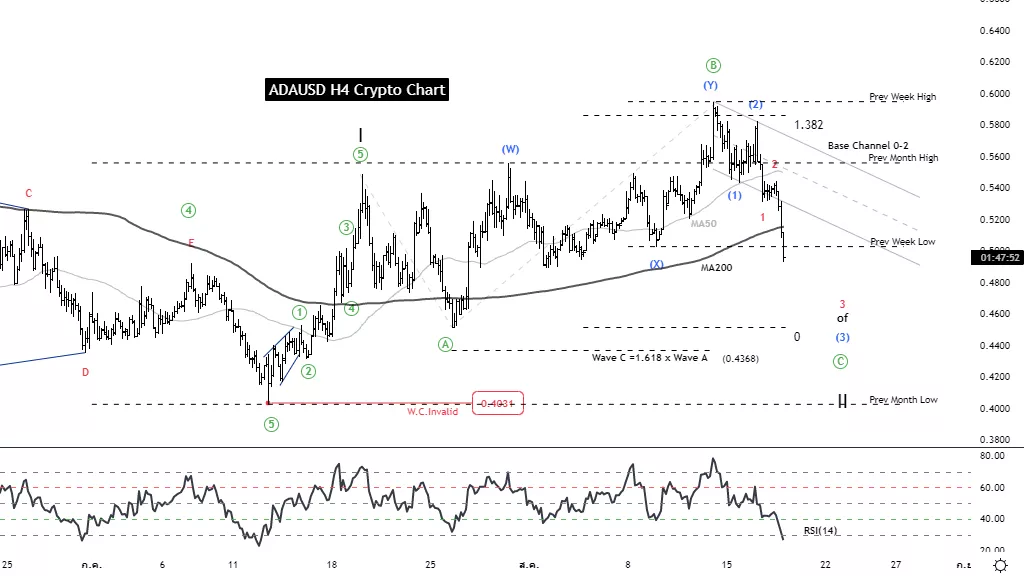
Elliott Wave Analysis TradingLounge 4H Chart, 19 August 2022, Cardano(ADAUSD)
ADAUSD Elliott Wave Technical Analysis
Function: Counter trend
Mode: Corrective
Structure: Flat
Position: Wave ((C))
Direction Next higher Degrees: Wave II of Motive
Details: corrective Expanded Flat In wave two, wave ((c)) is usual y 1.618 x wave ((A)).
Wave Cancel invalid Level: 0.4050
Cardano(ADAUSD) Trading Strategy: As this is a short correction to the uptrend so we should take the opportunity when the second wave is finished to join the trend again.
Cardano(ADAUSD) Technical Indicators: RSI enters Oversold Zone, beware of short-term reversal
(Click on image to enlarge)
More By This Author:
U.S. Stocks Elliott Wave Analysis And Trading Strategies
Elliott Wave Technical Analysis: Texas Instruments Inc.
Elliott Wave Analysis: Dogecoin



Comments
Log in or sign up to join the conversation.