Elliott Wave Technical Analysis: Cardano, Jan. 23
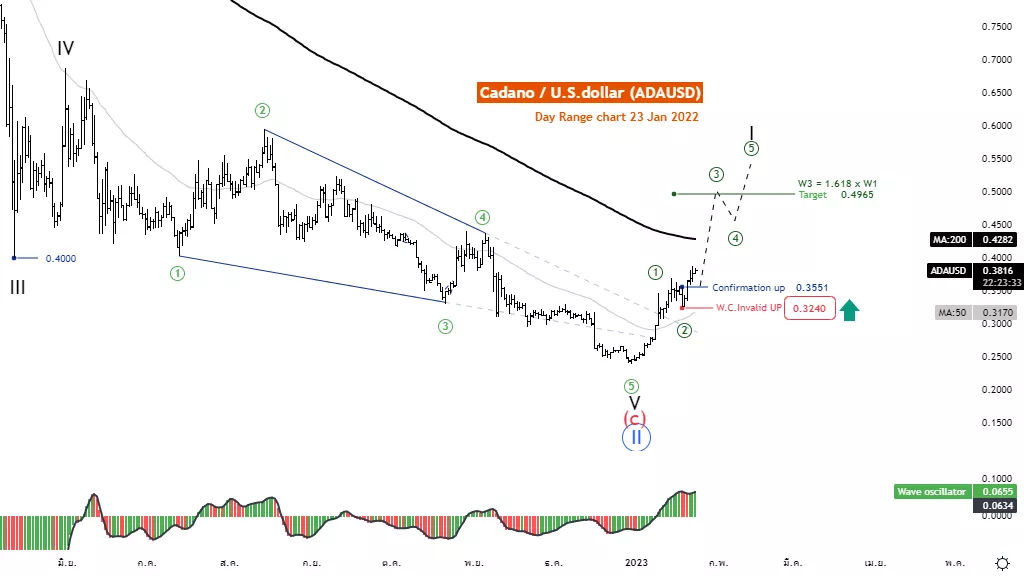
Elliott Wave Analysis TradingLounge Daily Chart, Jan. 23
Cardano/U.S.dollar(ADA-X)
ADAUSD Elliott Wave Technical Analysis
Function: Follow trend
Mode: Motive
Structure: Impulse
Position: Wave ((3))
Direction Next higher Degrees: wave I of Motive
Wave Cancel invalid level: 0.3240
Details: wave ((3)) length usually 1.618 x wave 1
Cardano/U.S.dollar (ADAUSD) Trading Strategy: Cardano Coin recovered well from the 0.2390 level, but since the price is still below the MA200, it may cause the price to be pressured by selling pressure. Trading should be done with caution.
Cardano/U.S.dollar (ADAUSD) Technical Indicators: The price is below the MA200, indicating a downtrend. The wave oscillators above Zero-Line Bullish momentum
TradingLounge Analyst: Kittiampon Somboonsod

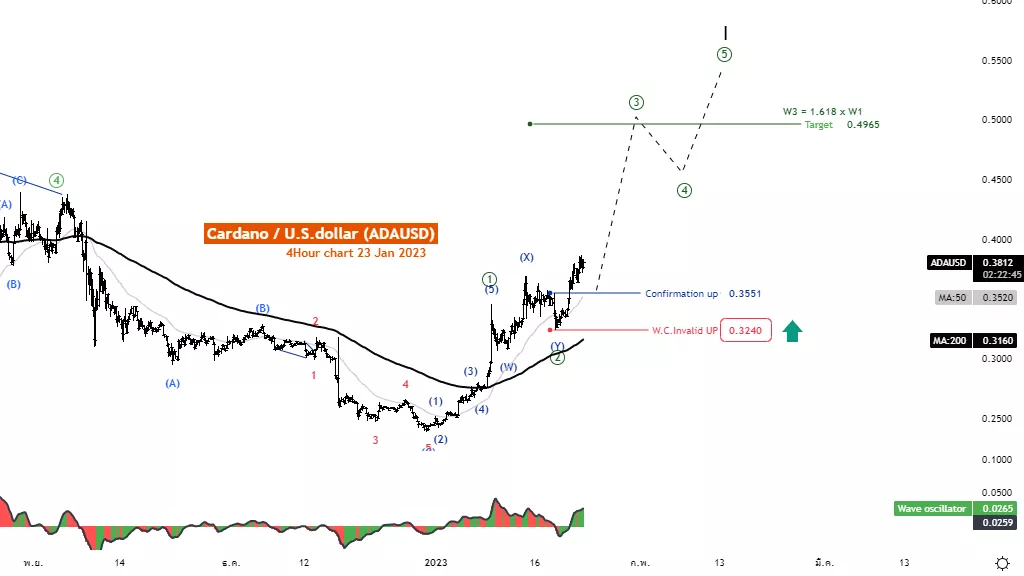
Elliott Wave Analysis TradingLounge 4H Chart, Jan. 23
Cardano/U.S.dollar (ADAUSD)
ADAUSD Elliott Wave Technical Analysis
Function: Follow trend
Mode: Motive
Structure: Impulse
Position: Wave ((3))
Direction Next higher Degrees: wave I of Motive
Wave Cancel invalid level: 0.3240
Details: wave ((3)) length usually 1.618 x wave 1
Cardano/U.S.dollar(ADAUSD) Trading Strategy: Cardano Coin on the 4 hour chart; the price continues to rise, we expect the current structure to be in the third wave of impulse, usually lasting equal to 1.618 x Wave ((1)) at the level of 0.4965, but the price must not reverse below 0.3240.
Cardano/U.S.dollar (ADAUSD) Technical Indicators: The price is above the MA200 MA50, indicating an uptrend. The wave oscillators above Zero-Line indicate Bullish momentum.

More By This Author:
Stay Ahead In Commodities: Analysis & Trading Strategies For Futures Trading
Elliott Wave Technical Analysis: Honeywell Inc.
NEO Coin U.S.dollar(NEOUSD) Elliott Wave Technical Analysis 20 January 23
Disclosure: As with any trading or investment opportunity there is a risk of making losses especially in day trading or investments that Trading Lounge expresses opinions on. Note: Historical ...
more


