
Elliott Wave Technical Analysis: Bitcoin Update

Image Source: Pexels
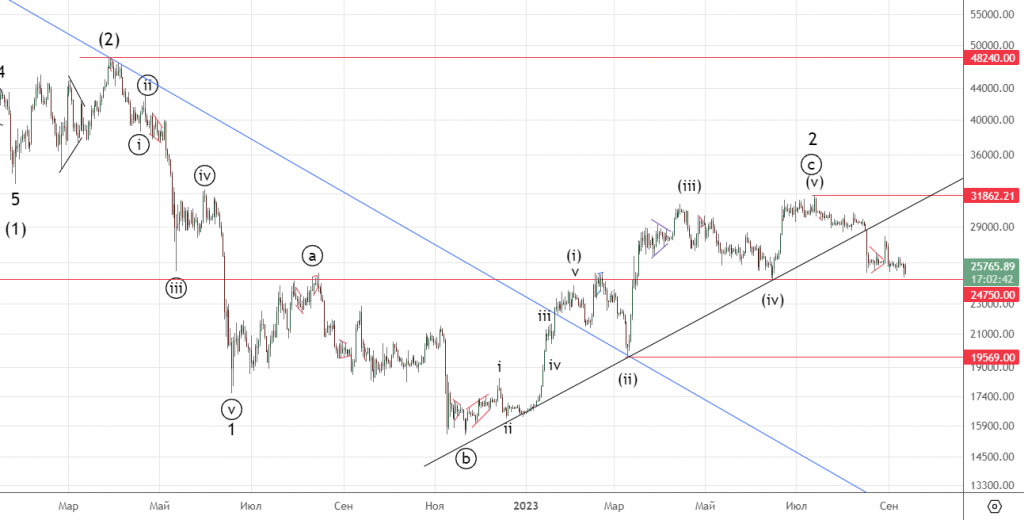
Last time it was said about the continuation of the decline, the importance of the level of 24750 was noted. Bitcoin (BITCOMP) came very close to this but did not break through. At the moment, it is assumed that there is a local correction, after which the fall will continue and the mark will be passed.
Daily chart
It can be seen that in previous months this mark was an important level of support and resistance. The trend line is also shown (in black). After breaking through from above, it becomes a resistance level.
(Click on image to enlarge)
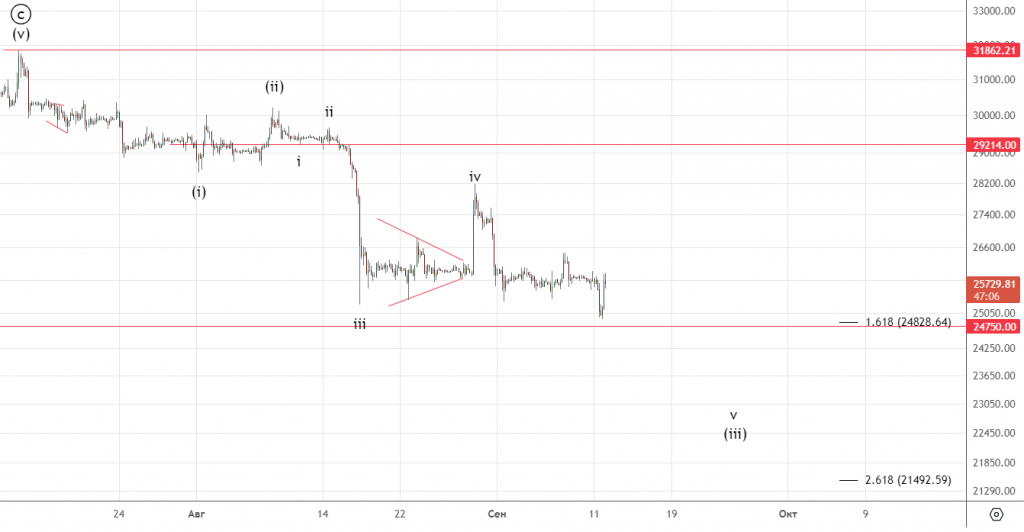
5-hour chart
In more detail. The objectives for (iii) are indicated.
(Click on image to enlarge)
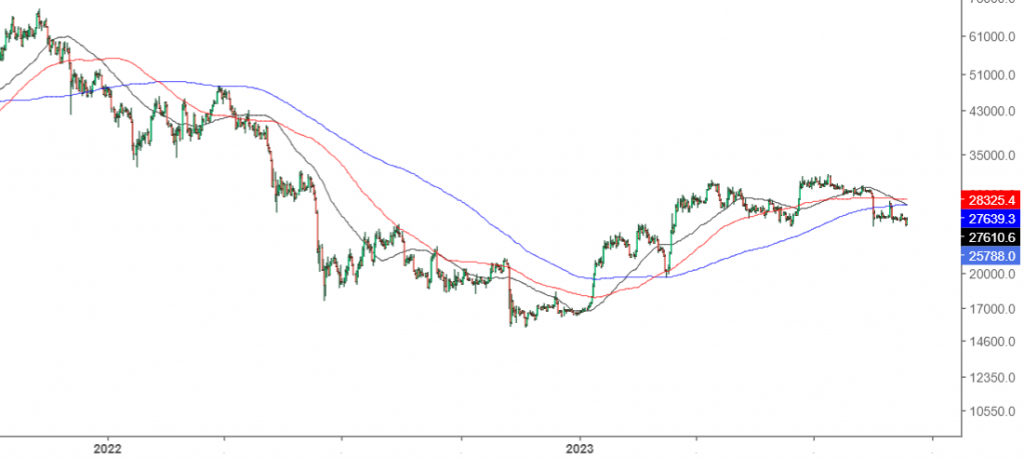
Medium lines
MA200 (blue) MA100 (red) MA50 (black).
Daily chart
Averages in a narrow range of 28325 — 27610. At the moment, they are all resistance levels. We have passed and tested the MA200, this is an important signal.
(Click on image to enlarge)
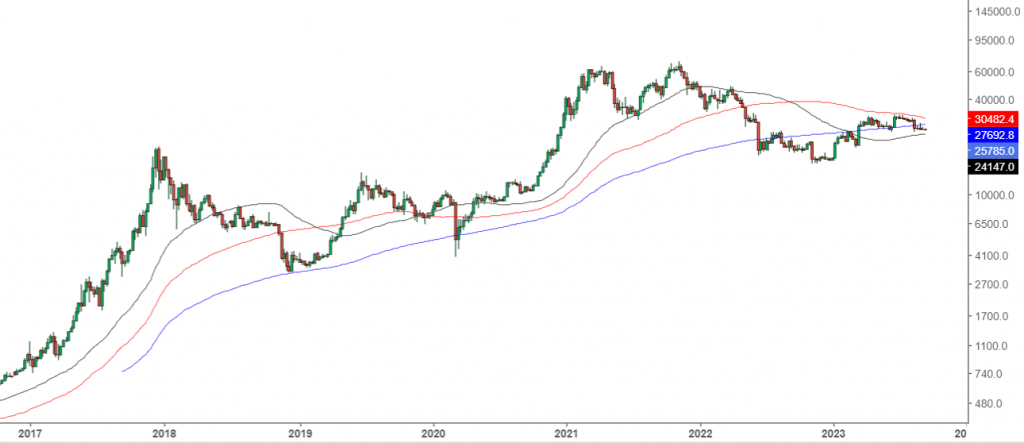
Weekly
There are also all averages at about the same levels. We need to pay attention to the MA 200, which we are currently testing. As can be seen in the long term, she was an important mark as well as the MA 100, which was tested, but not punched.
(Click on image to enlarge)
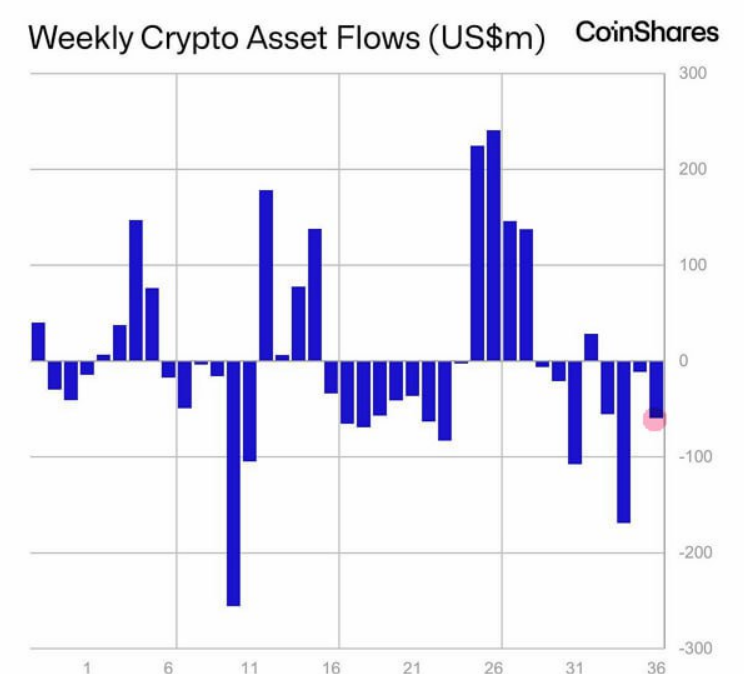
There is an outflow of funds from the crypt.
It is also worth paying attention to the strengthening of the dollar and the gradual decline of the stock market. It is assumed that this trend will continue.
Conclusion: The past forecast is currently being maintained and confirmed. We are waiting to overcome 24750, further important levels and goals on the charts.
More By This Author:
Elliott Wave Technical Analysis: The Dollar Index
Elliott Wave Technical Analysis: Bitcoin
The US Stock Market: Risk Of Reversal
Disclaimer: My opinion is provided as general market information and do not constitute investment advice


