Elliott Wave Analysis Indicates Persistent Selling Pressure For Ten Year Treasury Notes

Image Source: Pexels
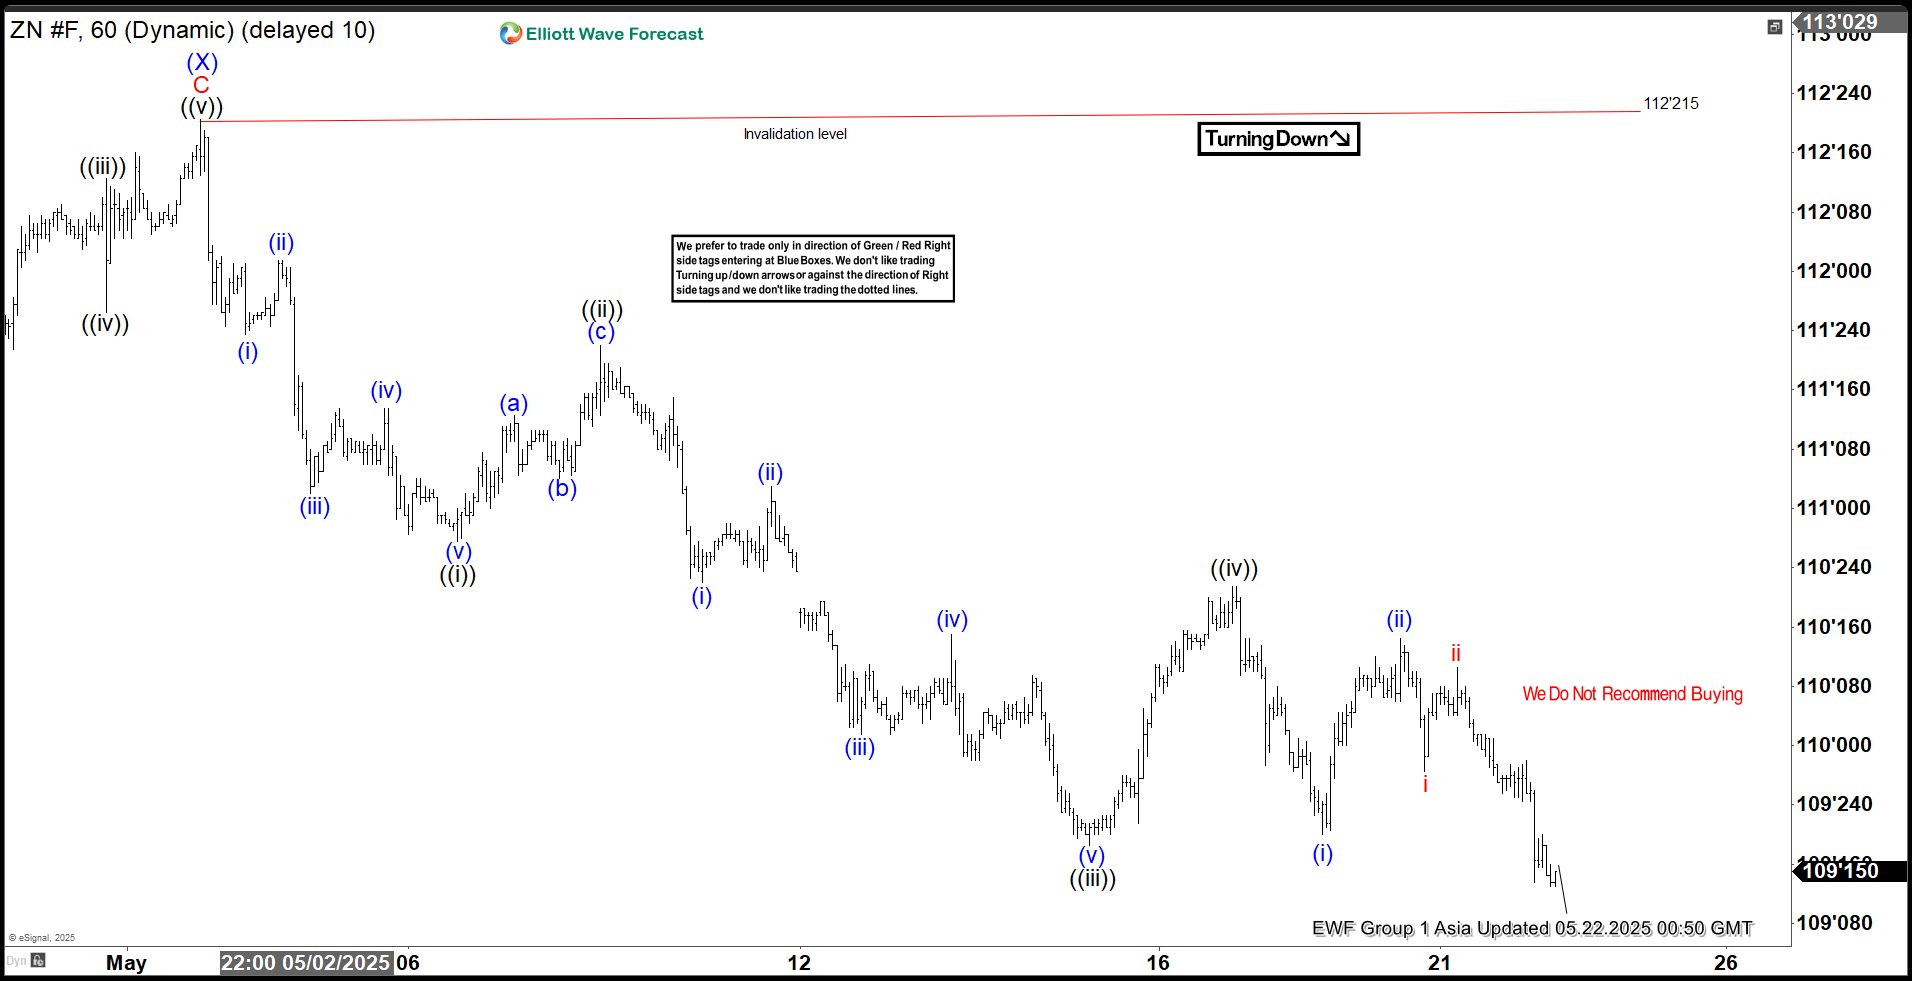
The decline in Ten-Year Treasury Notes (ZN) from the high on April 7, 2025, is unfolding as a double three Elliott Wave structure, signaling potential bearish momentum. From that peak, wave (W) completed at 109’08, followed by a corrective rally in wave (X) that topped at 112’02. The Notes have since turned lower, approaching a critical level below the wave (W) low of 109’08. A break below this level would confirm a bearish sequence, strengthening the case for further downside.
Within the ongoing wave (Y), the decline from the May 1, 2025, peak currently exhibits a five-wave impulsive structure, favoring continued downward pressure. From the wave (X) high, the initial decline in wave ((i)) ended at 110’27. A corrective rally in wave ((ii)) then followed peaking at 111’22. The Notes then extended lower in wave ((iii)), reaching 109’18, with a subsequent bounce in wave ((iv)) concluding at 110’21.
Currently, wave ((v)) is unfolding, structured as another five-wave sequence in a lesser degree. From the wave ((iv)) high, wave (i) ended at 109’20, and wave (ii) rallied to 110’14. As long as the pivot high at 112’21 remains intact, expect further downside in the Ten-Year Treasury Notes, with potential for increased volatility as the bearish structure develops.
Ten Year Notes (ZN) 60-Minute Elliott Wave Technical Chart
ZN Elliott Wave Technical Video
Video Length: 00:03:42
More By This Author:
Elliott Wave Analysis: EURUSD 5-Wave Rally Confirms Bullish TrendElliott Wave Analysis: Tesla Sustains Strong Upward Rally
Elliott Wave Update: Gold Miners At Key Support, Set For Potential Upside Move
Disclaimer: Futures, options, and over the counter foreign exchange products may involve substantial risk and may not be suitable for all investors. Leverage can work against you as well as for ...
more


