Elliot Wave Technical Analysis: BTC/USD
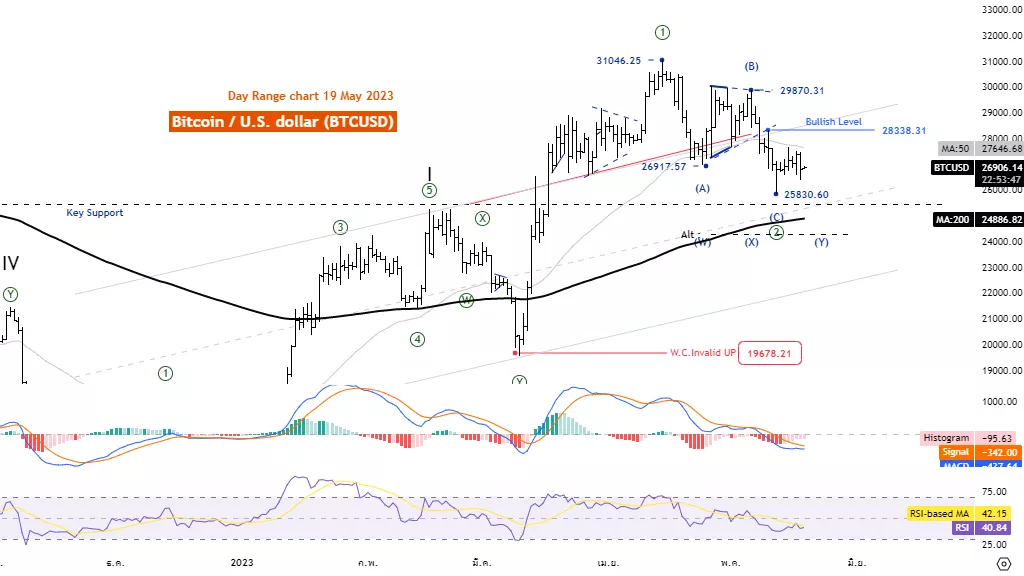
Elliott Wave Analysis TradingLounge Daily Chart, 19 May 23,
Bitcoin / U.S. Dollar
BTCUSD Elliott Wave Technical Analysis
Function: Reactionary(Counter Trend)
Mode: Corrective
Structure: Zigzag
Position: Wave(C)
Direction Next higher Degrees: wave ((2)) of Motive
Details: It is possible that wave ((2)) may have ended at the level of 25830.60. five wave rise And breaking level 28338.31 will support this idea.
Wave Cancel invalid level: 19559.36
Bitcoin / U.S. Dollar (BTCUSD) Trading Strategy: It is possible that wave ((2)) may have ended at the level of 25830.60. And breaking the level 28338.31 will support this idea. But even so, the price is still in a downtrend. Trading still needs to be done carefully.
Bitcoin / U.S. Dollar (BTCUSD)Technical Indicators: The price is above the MA200 indicating an Uptrend MACD and RSI are Bearish momentum.
(Click on image to enlarge)

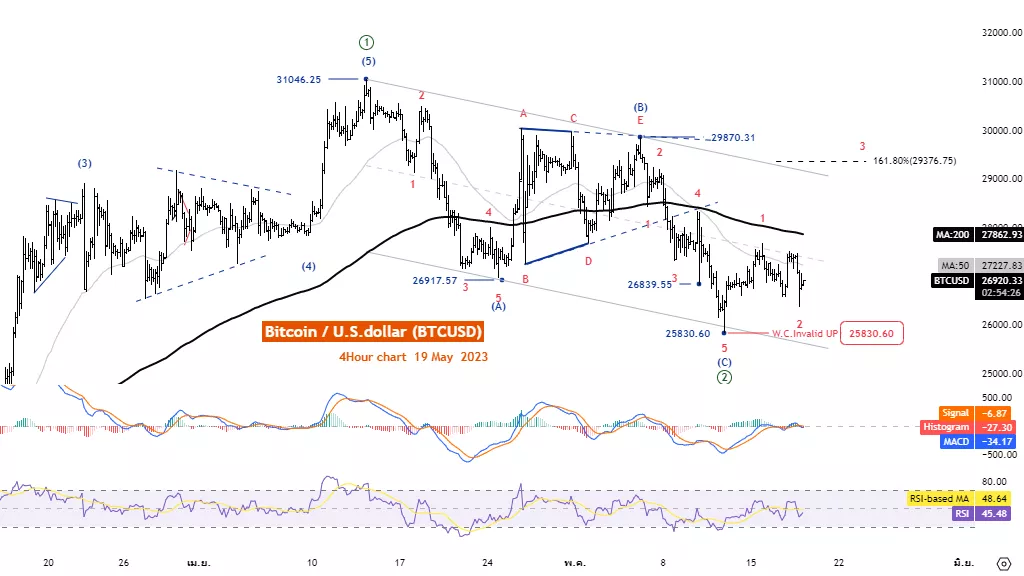
Elliott Wave Analysis TradingLounge 4H Chart, 19 May 23,
Bitcoin / U.S. Dollar (BTCUSD)
BTCUSD Elliott Wave Technical Analysis
Function: Follow Trend
Mode: Motive
Structure: Impulse
Position: Wave 2
Direction Next higher Degrees: wave (1) of Motive
Details: Wave 3 is usually equal to 1.618 multiplied Length of wave 1
Wave Cancel invalid level: 25830.60
Bitcoin / U.S. Dollar (BTCUSD) Trading Strategy: We expect wave ((2)) to have ended at the 25830.60 level and a five-wave rise will support this idea. But even then, there is a risk of falling below the MA200.
Bitcoin / U.S. Dollar (BTCUSD)Technical Indicators: The price is below the MA200 indicating a downtrend MACD and RSI are Bullish momentum.
(Click on image to enlarge)

More By This Author:
Stock Market Report - Elliott Wave
Elliott Wave Technical Analysis: VeChain, May 18
Elliott Wave Technical Analysis: PepsiCo, May 18
Analyst Peter Mathers TradingLounge™ Australian Financial Services Licence - AFSL 317817


