
Yields, Economic Growth, And Stock Prices - A New World For Investors
- Inflation causes a decline in purchasing power.
- The decline in purchasing power leads to a pronounced economic slowdown.
- This process causes commodities and yields to decline, and equities to pause.
C. M. Reinhart, V. R. Reinhart, and K. S. Rogoff studied extensively the historical implications of high debt on economic growth in many countries since 1800. Their work applies perfectly to what is happening now. Their conclusions - large amounts of debt are conducive to low economic growth.
The persistent downtrend and current levels of bond yields since the 1980s suggest the debt of the US has reached the critical stage causing the economy to grow at a well-below average pace. The experience of the past 20 years of Japan and Europe – and now China - is too telling to be ignored.
As Sydney Homer suggested a long time ago - interest rates are the fever chart of any economy. Bond yields at historically low levels reflect global economic difficulties. The experience of these countries shows it is difficult to escape stagnation with excessive money printing.
Growth comes by generating wealth and wealth is generated by increasing the productivity of a country - producing more with the same amount of time. Unfortunately, the US economy is moving in the wrong direction with productivity sinking 5.0% in Q3,
Productivity, of course, is related to profitability. It is no coincidence global equity markets of developed and largely indebted economies (EU, Japan, China) have underperformed the US market since 2007.
On March 1, 2021, I wrote Buy Bonds For A Trade. Since then, I suggested in almost every article, lower commodities and lower yields were likely due to the business cycle slowdown. At that time the yield on the 30-year Treasury bonds was 2.23%. Since then, I indicated the business cycle was going to reflect a slowing down economy accompanied by weaker commodities and yields.
Source: Profiting in Bull or Bear Markets – How Business Cycles Impact The Financial Markets
What can we learn from history?
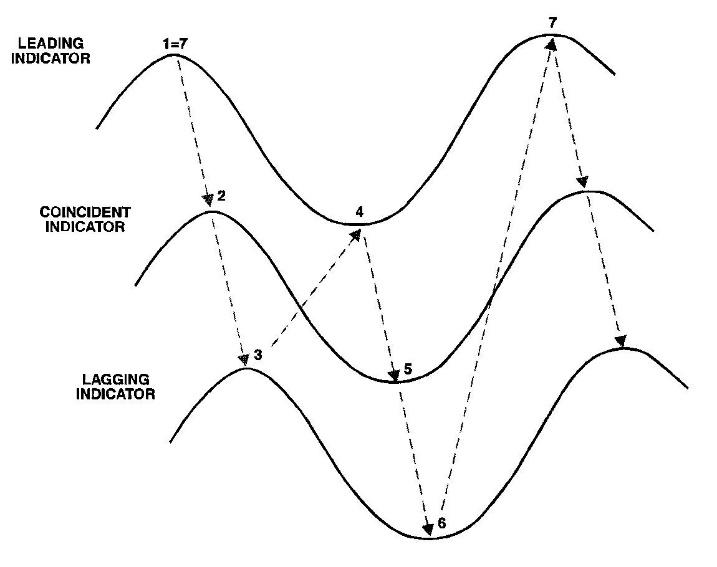
The clue is provided by inflation. Inflation is a lagging indicator. It means it rises after one-to-two years after an expansion gets under way. Like all the lagging indicators (employment costs and interest rates are two other important ones) their rising trend has an important impact on business and consumer decisions. A rise in inflation (a lagging indicator) is followed by declining consumer sentiment (a leading indicator) which is followed by declining business activity (a coincident indicator) (see above chart).

Source: St. Louis Fed, The Peter Dag Portfolio Strategy and Management
The economic cycle is best illustrated by what happened in the 1970s (see above chart). Inflation started rising one-to-two years after the expansion. The persistent rise of inflation was followed by slower economic growth/recession. The more virulent is the increase in inflation, the sharper is the economic slowdown/recession. The sooner inflation raises its ugly head, the shorter is the business cycle. The main reason is rising inflation reduces the purchasing power of consumers.

Source: St. Louis Fed, The Peter Dag Portfolio Strategy and Management
Interest rates are also a lagging indicator and their performance during a business cycle follows closely the trend of inflation as it happened in the 1970s, having a negative impact on consumers, business, and equities (see above chart).

Source: The Peter Dag Portfolio Strategy and Management
The problem of rising inflation, rising interest rates, and rising employment costs is they reduce the attractiveness of holding equities. It is no surprise the market showed little or no gains in the 1970s (see above chart).
Where do we go from here?
The answer is provided by the trend of inflation and labor costs.
Inflation has been rising steadily since the end of 2020. Producer prices of commodities jumped 22.2% y/y. Producer prices of finished goods soared 12.5% y/y. Consumer prices rose 6.2% y/y (see above chart).

Source: St. Louis Fed, The Peter Dag Portfolio Strategy and Management
The recent increase of inflation has been having a negative impact on personal income adjusted for inflation and after tax which has been declining since March 2021 (see above chart).

Source: University of Michigan
It is no coincidence rising inflation and declining purchasing power have been accompanied by a sharp decline in consumer sentiment to levels associated in the past with recessions (see chart).


Source: St. Louis Fed, The Peter Dag Portfolio Strategy and Management
The problem with inflation is that it is also transmitted to business via rising input costs – raw materials and especially employment costs (see above chart). Rising employment costs, of course, have a major negative impact on business profitability.
Business cycle history and the relationship between lagging and leading indicators also suggest the higher inflation and employment costs rise, the more pronounced the subsequent slowdown will be. The reason is consumers refrain from aggressive buying until their purchasing power is re-established, waiting for inflation to fall to the previous lows.

Source: The Peter Dag Portfolio Strategy and Management
The decline in purchasing power of consumers and the increase in labor costs (compensation and benefits) is slowly causing the business cycle to decline, reflecting slower economic growth. The decline in the business cycle will be accompanied by lower commodities and lower yields.
The depth of the economic decline depends on how long it will take to bring inflation down to previous lows.
Key takeaways
- Rising inflation reduces consumers’ purchasing power.
- Rising inflation is followed by a decline in consumer sentiment.
- A decline in consumer sentiment is followed by slower sales and unwanted inventory accumulation, creating headwinds for profits.
- Rising labor costs further reduce profitability, forcing business to reduce production to bring inventories in line with sales.
- Commodities and yields decline as business slows down. The equity market pauses.
- The slowdown ends, and commodities and yields bottom, following a protracted decline in inflation and bond yields. This is the time when consumers’ purchasing power increases, reflected by rising consumer sentiment, stronger sales, and a strong equity market.
- The growth of the money supply M2 declines from the 12%-24% pace of the last 18 months to close to the average historical pace of about 6%.
- The current business cycle peaked in the first half of this year.
The business cycle indicator shown in the above chart is a proprietary indicator computed in real-time and published in each issue of The Peter Dag Portfolio Strategy and Management. A complimentary ...
more

