
Where Is Inflation Hiding? In Asset Prices
A very dangerous fallacy has taken the world of economics by storm over the last several years: the idea that there is very little inflation in the U.S. economy, therefore interest rates should remain at unusually low levels for an even longer period of time. As I will prove in this piece, the people who believe in the “low inflation” myth are being fooled by the fact that inflation in this unusual, central bank-driven economic cycle is concentrated in asset prices rather than in consumer prices. By holding interest rates too low for too long, a massive asset bubble has inflated and is poised to inflate even further as long as economists and central banks like the Fed continue to be fooled by the “low inflation” myth. Unfortunately, the ultimate bursting of this unprecedented asset bubble is going to throw the U.S. and global economy into another depression.
One of the most fervent believers in the “low inflation” myth is President Donald Trump himself. Trump has complained many times about the Fed’s interest rate hikes that have occurred during his presidency. Over the past three years, the Fed hiked rates from 0% to 2.5%, which is still extremely low considering that rates above 5% were common throughout history. As Trump said earlier this month –
“Well I personally think the Fed should drop rates,” Mr. Trump said. “I think they really slowed us down. There’s no inflation. I would say in terms of quantitative tightening, it should actually now be quantitative easing. Very little if any inflation. And I think they should drop rates, and they should get rid of quantitative tightening. You would see a rocket ship. Despite that, we’re doing very well.”
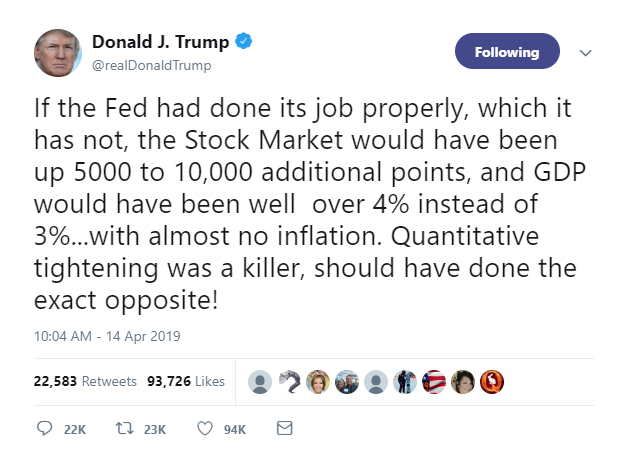
Trump reiterated his “no inflation” belief in a tweet yesterday:
(Click on image to enlarge)
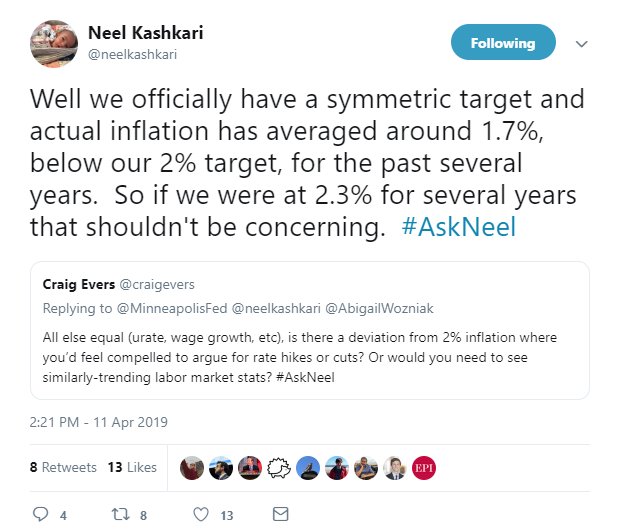
Neel Kashkari, president of the Federal Reserve Bank of Minneapolis, recently summarized the Fed’s position that inflation is still low and even believes that the Fed should let inflation run above its target for a few years:
(Click on image to enlarge)
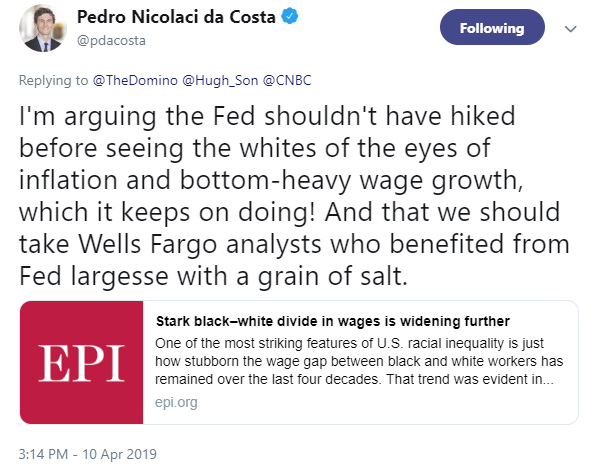
Many prominent financial journalists and commentators including my friend Pedro da Costa believe that the Fed has been hiking interest rates too aggressively:
(Click on image to enlarge)
The well-known investing pundit and host of CNBC’s “Mad Money” TV show Jim Cramer is a vocal Fed rate hike critic and believer in the “low inflation” myth:
“Memo to Powell: keep listening. Be patient. Enjoy the employment gains. Let’s keep the strength going by waiting a little and not being too judgmental about rate hikes like some of your colleagues,” Cramer said.
The “Mad Money ” host reiterated his distaste in some Fed officials’ tendency to stick to traditional metrics when gauging how the economy is doing.
“How can you claim to be data-dependent if you’ve made up your mind before you see the data that you need one or two more rate hikes to get back to normal?” he asked. “Normal is where the data says you should go. Normal is the natural progression of jobs being created without a lot of inflation. Normal is not a percent.”
Belief in the “low inflation” myth stems from the overly rigid reliance on conventional inflation indicators even though we have been in an unconventional economic cycle since 2009 (because it has been driven by record low-interest rates and trillions of dollars worth of quantitative easing). In this type of environment, it is wise to think outside of the box and to consider all information available, but most economists are still stuck in the past as if we are in a garden-variety business cycle in the twentieth century.
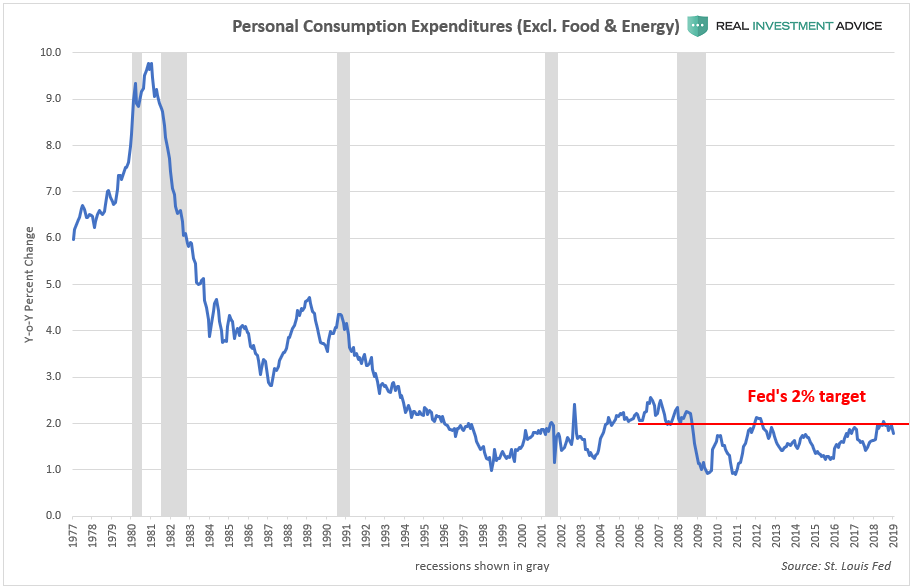
The Federal Reserve’s preferred inflation indicator is the core personal consumption expenditure price index (excluding volatile food and energy), which tracks the prices of U.S. consumer goods and services. The Fed has an official target of 2% annual inflation, but inflation has been running cooler than that since the Great Recession according to the core PCE index.
(Click on image to enlarge)
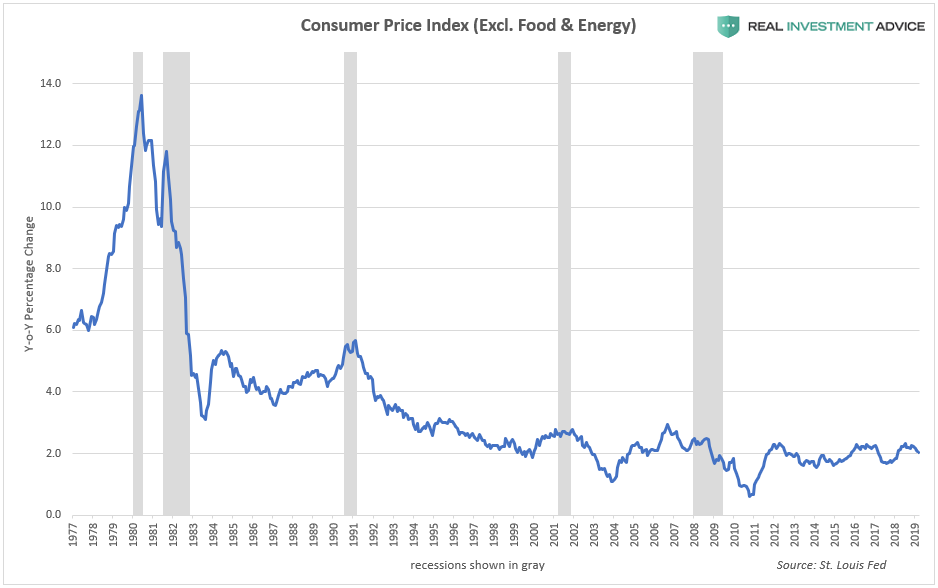
The inflation index most commonly referenced in the financial media is the core Consumer Price Index or CPI (excluding volatile food and energy). The core PCI tells a similar message as the core PCE index: consumer price inflation has been tepid since the Great Recession.
(Click on image to enlarge)
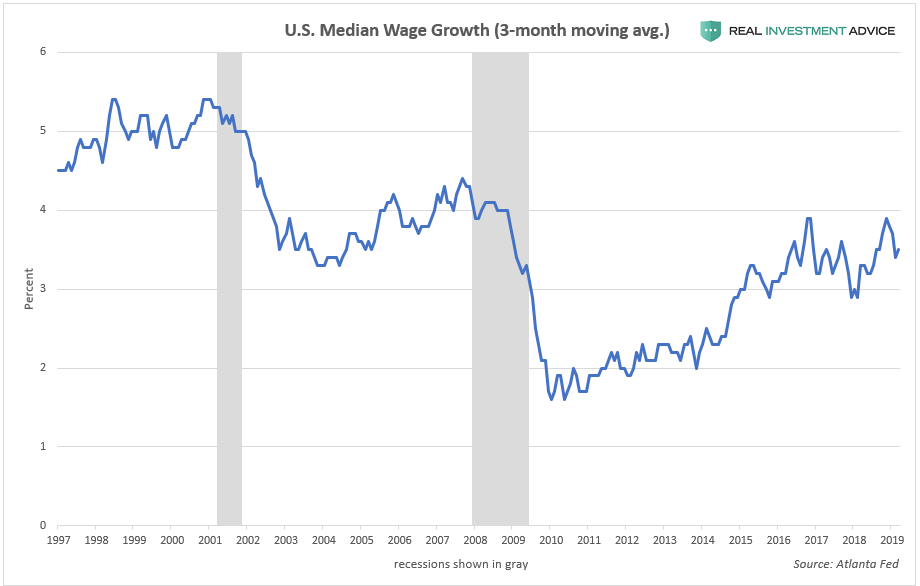
Wage growth has also been quite low since the Great Recession:
(Click on image to enlarge)
Overly rigid reliance on conventional inflation indicators has made the mainstream economics community completely blind to the elephant in the room, which is the fact that inflation has been concentrated in asset prices rather than consumer prices. As the chart below shows (which I’ve recreated from a chart made by Goldman Sachs a couple of years ago), assets such as global stocks and bonds have risen at a much higher rate than global real economy prices since the current bull market began in March 2009.
(Click on image to enlarge)
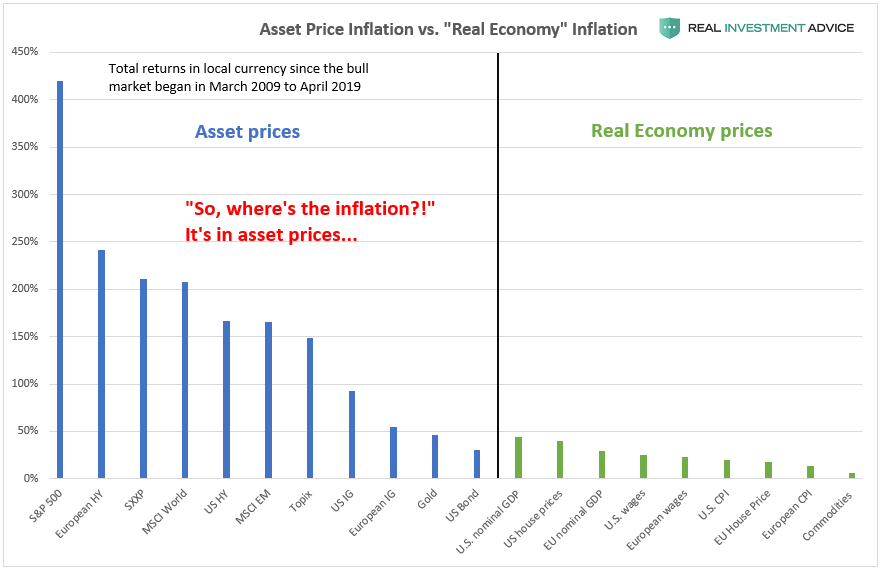
Consumer price inflation has remained low while asset price inflation has exploded because asset prices have been acting like a relief valve for inflationary pressures that have been created by record low global interest rates and the pumping of trillions of dollars worth of liquidity into the global financial system. This doesn’t mean that we don’t have an inflation problem; we have a tremendous inflation problem on our hands, but you need to know where to look.
This Wikipedia entry explains how relief valves work in the mechanical world –
A relief valve or pressure relief valve (PRV) is a type of safety valve used to control or limit the pressure in a system; pressure might otherwise build up and create a process upset, instrument or equipment failure, or fire. The pressure is relieved by allowing the pressurised fluid to flow from an auxiliary passage out of the system. The relief valve is designed or set to open at a predetermined set pressure to protect pressure vessels and other equipment from being subjected to pressures that exceed their design limits. When the set pressure is exceeded, the relief valve becomes the “path of least resistance” as the valve is forced open and a portion of the fluid is diverted through the auxiliary route. The diverted fluid (liquid, gas or liquid–gas mixture) is usually routed through a piping system known as a flare header or relief header to a central, elevated gas flare where it is usually burned and the resulting combustion gases are released to the atmosphere. As the fluid is diverted, the pressure inside the vessel will stop rising. Once it reaches the valve’s reseating pressure, the valve will close.
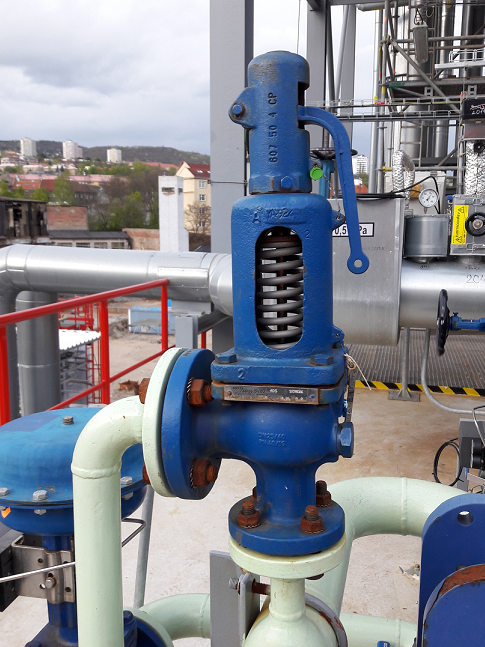
A pressure relief valve. Image source: Wikipedia
As discussed earlier, the U.S. is currently experiencing a massive asset bubble due to the Fed’s aggressive, unconventional monetary policies during and after the Great Recession. The first of these policies is known as zero interest rate policy or ZIRP. The Fed cut its benchmark interest rate (the Fed Funds rate) to virtually zero and held rates at record low levels for a record length of time. Asset and credit bubbles often form when central banks cut interest rates to artificially low levels because it becomes much cheaper to borrow, low rates discourage saving and encourage speculation in riskier assets & endeavors, and because they encourage higher rates of inflation, to name a few examples. The dot-com and U.S. housing bubbles formed during relatively low-interest rate periods as well.
For the author's full disclosure policy, click here.


