
Using Our Money To Steal Our Money
We now have the highest rates of inflation in forty years - but this inflation is much more painful than it was forty years ago.
As we will explore in this analysis, the difference is that forty years ago we had interest rates that were higher than the rate of inflation, so we could keep up as savers. However, we now have effectively zero percent interest rates. This translates to fast and painful monthly decreases in purchasing power that are occurring right now for anyone who has money in the bank, or in a money market fund.
What makes it worse is that the near zero percent interest rates are not natural, but are the result of major Federal Reserve market interventions - and since 2008, the new primary source of funds for the Fed has been the spending power in our bank accounts.
In combination then, the Fed is using the money we deposited in our bank accounts to force major inflation-adjusted losses on the value of the money that is in our bank accounts. There is nothing natural or normal about this, this is a taking on two levels - with the government benefitting on both sides, and the citizens losing on both sides.
This analysis is part of a series of related analyses, which support a book that is in the process of being written. Some key chapters from the book and an overview of the series are linked here.
Recent Developments With Negative Interest Rates
The number one determinant of whether a saver is gaining wealth or losing wealth is not the interest rate, nor the rate of inflation, but the interest rate after adjusting for inflation. This is called the real interest rate, or real yield.
If an interest rate is 10% and inflation is 0% - then at the end of the year, the saver is up by 10% in purchasing power terms, what their money will buy for them.
If an interest rate is 10% and the rate of inflation is 10% - then the saver is not getting ahead but is breaking even (at least on a pre-tax basis). Take a nominal yield of 10%, subtract inflation of 10%, and the real yield is 0%.
However, if the interest rate is 0%, and the rate of inflation is 10%, then the real yield is negative 10%. Start with $100, and if at the end of that year the purchasing power of the $100 is only $90 because of inflation, then the saver has not broken even but has lost 10% of what they started with.
The problem with monthly inflation statistics is that they can bounce around a lot, while annual inflation statistics move too slowly to catch fast-moving developments within the same year, such as we have seen since March of 2021. A compromise solution for smoothing out some of the "noise", while keeping up with recent developments, is to use a 3 month rolling measure, that looks at the last three months for interest rates, inflation rates, and real (inflation-adjusted) rates.

The yellow line above is 3 month Treasury yields, which show what is happening with short-term, high-quality interest rates. These were about 2% until the pandemic shutdowns, at which time the Federal Reserve slammed interest rates down to near zero percent.
The red line is the annualized rate of inflation, and in this case, we are using the Consumer Price Index (CPI-U), as reported by the U.S. Bureau of Labor Statistics. Now, whether that is accurate or not is up to the reader, there is a strong case to be made that it understates the true rate of inflation. So, while we will use the seemingly objective and authoritative measure of inflation as reported by the U.S. government, there is a case for somewhat increasing the rate of inflation (which then increases the degree of negative real rates).
We are now seeing a third spike of inflation. The first was the price recovery from the little burst of deflation - where the red line went below zero - in the peak of the shutdowns. That recovery was complete by August of 2020 - every month since then has set a new record when it comes to a new lower purchasing power for the U.S. dollar.
The second spike was caused by something new, as caught in real-time in my May of 2021 analysis, "The Current & Future Supply Side Inflation Shocks" (link here). The problem was the supply chain issues while the system was flush with money, too many dollars chasing too few goods. As described in that analysis:
"Keeping the dollars increasing and the spending up while the physical supplies shrink is like writing out a prescription for inflation - and that is exactly what we are seeing."
This is not money printing, nor is it transitory. It is a fundamental source of inflation, that is now at risk of becoming embedded in an inflationary wage/price spiral, particularly as the supply chain shortages continue. If this inflation is to be stopped, then there needs to be an intense national focus from the top down on fixing the supply chain problems - but there instead seems to be near indifference when it comes to actually doing anything concrete about it, other than throwing out a few platitudes at press conferences.
The costs of goods are rising rapidly, as are the costs of wages in many industries, which creates another round of price increases. The value of money in the bank isn't moving due to near zero percent interest rates - so that means that the value of what our bank accounts will pay for is falling. Fast.
When we take the yellow line of what we are earning on our money in the bank, and we subtract the red line of inflation, then we get the green line of real rates - what we are actually earning. We've been losing money, in terms of purchasing power continuously since July of 2020. There was a burst of losing value that peaked at a 5.6% annualized loss in August of 2020.
The supply chain issues caused a second and much more powerful burst of inflation, as the prices of gas, autos, lumber, housing, and groceries all leaped upwards. This was expressed in the second spike in inflation peaking at an annualized rate of 9.64% by June of 2021. Because interest rates were being held down by the Fed to 0.04%, that means that our money was being held back, unable to keep up, and as seen by the green line spiking downwards, we as a nation were losing money at an annualized rate of about 9.60%.
Things backed off a bit, but not all the way back, as the 3 month rolling rate of inflation very briefly fell to a low of 4.70% in September of 2021 - still almost 3X the 1.6% average reported rate of inflation between 2009 and 2020 - before spiking right back upwards to 6.66% the following month.
In the fall and winter of 2021, there were recurring front page stories in the Wall Street Journal, of a type that had not been seen in decades. Costs for corporations were rising fast, in terms of both supplies and labor. Consumers were still flush with cash. And companies that had formerly been fearful of raising prices were now raising those prices. Indeed, some of the CEOs in a range of industries sounded almost gleeful about their ability to not only raise prices, but to raise prices several times in the same year, increasing profits and without losing sales.
This is something that we haven't seen since the late 1970s and early 1980s, as companies change their pricing behavior for inflation. This is on top of and adding to the ongoing supply chain issues as a source of inflation. This is critical information - the primary source of inflation, supply chain shortages in a system flush with money, is now leading to behavioral changes by corporations and workers, that are creating secondary sources of inflation, that can then become self-reinforcing wage/price spirals. If inflation were a cancer, this could be called metastasizing, as the inflation spread through the body of the economy in the fall and winter of 2021, so that curing the original source would not necessarily now rid the economy of the inflation.
The red line of inflation spiked upwards again, reaching a 9.13% level by December of 2021. Because maintaining near zero percent interest rates was still a matter of official Federal Reserve policy, short-term interest rates remained very low, with 3 month Treasury yields only averaging 0.06%. This means that the green line of real interest rates spiked back down to annualized losses in purchasing power of 9.07% (if we accept the government's inflation numbers as accurate).
As a matter of policy, we the nation are being forced to take about a close to 10% annualized loss on the real value of our money in the bank and in money market accounts.
The Source Of The Money
The Federal Reserve couldn't force pervasive and ongoing negative interest rates to this degree in the past - because as a matter of design, it did not have the money to do so. For medium and long-term interest rates in particular, the market was supposed to be setting the rates, at levels that appropriately adjusted for inflation. In free markets, investors don't generally volunteer to invest at rates that lock in inflation-adjusted losses, and this meant that interest rates were usually higher than the rate of inflation.
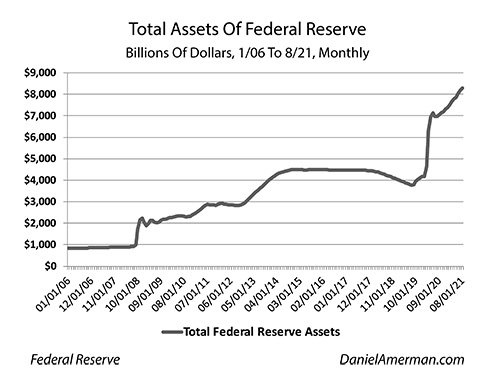
A radical change occurred in 2008 - all of a sudden, the Fed did have the money. The Federal Reserve almost doubled in size in a few months. And the Federal Reserve is now getting close to ten times the size of what it was before its primary source of funding changed.
There are a lot of myths and misunderstandings out there about the source of the money for the Federal Reserve's trillions of dollars in new spending since 2008. Many people believe it is all money printing - and there is indeed some money printing going on - but the primary new source of money has been much larger, particularly when the Fed needs a lot of new money in a short period of time, as has been the case since 2019.
As introduced in Chapter One of "The Stealthy Raid On Our Bank Accounts" (link here), the primary source of the new trillions to spend was Congress opening up a new back door access to the spending power of our bank accounts. As explained in the book, when we follow the actual dollars, over $4 trillion of the new financing for the Fed has come from a new ten step process, where the first step is our depositing our money at our bank, and the tenth step is the U.S. government spending that money - after having used the spending power of our savings to fund the national debt.
As explored in Chapter Four, it was our money that Wall Street and the major European banks used to rescue themselves in 2008. When we follow the dollars at the height of the pandemic shutdowns in Chapter Six, then we can see that the miracle funding for the stimulus checks in early 2020 had actually been sitting in our bank accounts just weeks before. The government was taking our own money to fund the checks to us (in a redistributed form).
When we look at the current pervasive steeply negative interest rates - then as explored in Chapter Seven, the current interest rate environment is based upon the Fed using the massive monetary power contained in our bank accounts, to take effective control of short, medium, and long term interest rates, moving them to where it would like them to be.
Artificial & Deepening Losses
The key difference for savers between the current high inflation and the high inflation of forty years ago is the level of interest rates. As one example, average annual interest rates on 10 year Treasury obligations were over 10% for six straight years, from 1980 through 1985. There was a radically different relationship between inflation and interest rates - that worked much better for protecting the purchasing power of savings from inflation - than the current artificial environment.
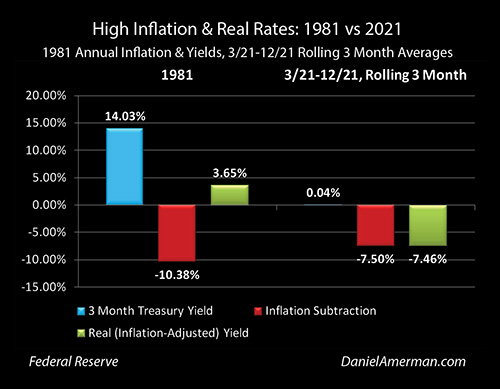
This warping of the relationship between interest rates and inflation can also be seen in the graph above. In a more natural market environment in 1981, savers were able to earn 14.03% average interest rates on 3 month Treasuries, so they were being compensated for inflation, and came out on average 3.65% even after subtracting the costs of a 10.38% rate of inflation.
We now have sustained 7.5% inflation again, the highest since 1981, but the difference is the Federal Reserve is only allowing us to earn an average interest rate of 0.04% (and banks aren't even necessarily paying that). Almost all of the new inflation is coming straight out of our real net worths - and this is not a natural relationship.
Regular readers might remember a very similar graph from early last fall - and the similarity is the problem. At the time, averaging the rolling three-month rates of inflation from March through August produced about a 7.5% negative return. Now that we have added the inflation numbers for September through December, the bottom line has hardly changed, savers are losing the value of their savings at about a 7.5% annual rate.
The rates of inflation are not just the highest in forty years, but they are the most persistent, as explored in the analysis linked here.
Persistent Financial Abuse
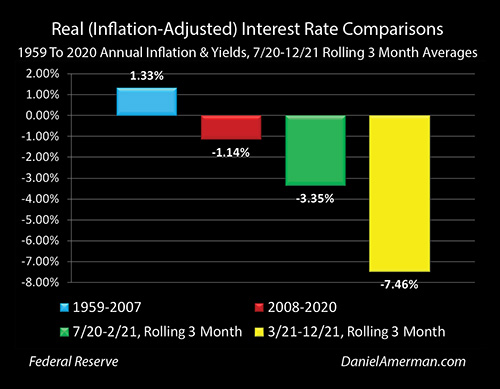
The graph of real interest rates above could be called a graph of how the Federal Reserve has been using its new back door access to our bank accounts for the benefit of the government, Wall Street, and major corporations - and to the major detriment of the citizens of our nation.
The blue bar is what is natural, the relationship between interest rates and inflation before the Federal Reserve expanded its powers. What was natural between 1959 and 2007 was for savers to come out 1.33% ahead of inflation, so that they were being appropriately compensated for inflation, and could still build real net worth even after accounting for inflation.
The red bar shows what the Fed did with its new powers between 2008 and 2020. Lowering interest rates below the rate of inflation is beneficial for a heavily indebted U.S. government as well as the numerous financial firms and major corporations that benefit from historically low-cost sources of funding. The price was born by the rest of the nation, as the natural relationship between interest rates and inflation was flipped, so that the nation now on average lost 1.14% of the value of its savings each year, instead of slowly building real wealth.
The government changed the law to allow the Federal Reserve access to the spending power of our bank accounts. The Fed used that awesome new financial power to strip us of the natural returns we should be earning on our money, and to effectively redistribute that wealth to the government, Wall Street, and the major corporations. They were effectively making sure we would never be paid back our money in full, not in inflation-adjusted terms.
There is another word for taking money from someone and making sure that they won't be paid back in full - theft. Yes, the government sets up the laws so that taking from citizens is perfectly legal. But, this was a new and stealthy form of theft, that created great new wealth for insiders, even as the average person grew a little poorer each year. This was a matter of deliberate design that overrode free markets to create an artificial flow of wealth from the many to the few, with the funding for the overriding of the markets coming from our own savings.
The situation got much worse between July of 2020 and February of 2021, as shown with the green bar, with the degree of negative interest rates almost tripling.
The yellow bar continues the downward progression and shows what happened when the intersection of plentiful money and scarce goods created the current much higher rate of inflation starting in March of 2021 - but interest rates still did not budge.
We now have a massive, extraordinary taking of wealth from the people of the nation, to the benefit of the government as well as the financial firms and major corporations that profit from artificially low interest rates. An entire nation is losing real wealth at an unprecedented rate.
And even if the Fed does allow rates to go up by 1%, or 2%, or 3% - the financial abuse and punishment of many millions of savers will still be occurring at some of the highest rates in history.
Yet - for some curious reason, this is not headline news. It should be. People need to know what is being done to them on a quite deliberate basis, and how the steady impoverishment of the middle class of an entire nation is a matter of governmental policy. Hopefully, this analysis has been helpful to you in that regard.
Learn more about the free book.
Disclosure: This analysis contains the ideas and opinions of the author. It is a ...
more

