
The Return Of The Fed’s Balance Sheet Policies
The Federal Reserve has increased the size of its balance sheet by a third of a trillion dollars over the last 15 weeks, returning to tools that a short while ago we thought it had abandoned. But the Fed’s current goal in these operations is quite different from what we had seen earlier.
One of the factors causing the renewed growth of the Fed’s balance sheet is the Fed’s direct purchases of securities. By the end of 2014, the Fed held over $4 trillion in securities. At the end of 2017, it began to reduce those holdings gradually. But last summer the Fed returned to a policy of reinvesting maturing assets in order to keep its level of securities constant. And two months ago the Fed resumed net security purchases, causing its balance sheet to grow again.
(Click on image to enlarge)
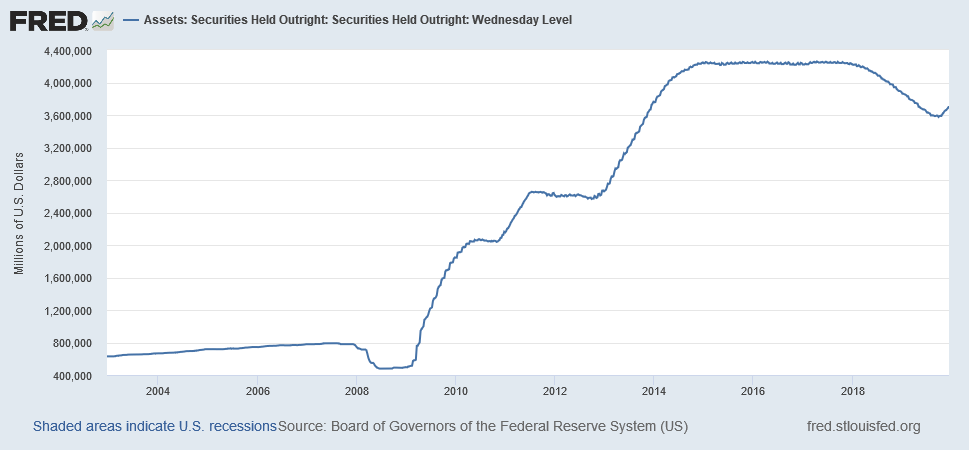
Securities held outright by the Federal Reserve in millions of dollars, Wednesday values, Dec 18, 2002, to Dec 11, 2019. Source: FRED
The Fed’s goal in increasing its securities holdings through 2014 was to hold down long-term interest rates. The idea was that if the Fed took a large enough volume of long-term bonds out of the hands of private investors, it might increase the market price of the bonds, or equivalently, lower their yield. The empirical and theoretical evidence that this strategy could have a substantial effect on long-term yields remains controversial. But whatever the merits of this theory, it is not the motivation for the Fed’s recent purchases. These have all come in the form of purchases of short-term Treasury bills, not the long-term bonds that the Fed was buying in volume over 2009-2014.
A bigger factor in the resumed growth of the Fed’s balance sheet has been repurchase agreements. These are essentially a collateralized short-term loan from the Fed to primary dealers. Before 2008, the Fed regularly used these to fine-tune its control of interest rates, entering into small repurchase agreements if it wanted to put some additional reserves temporarily into the banking system. In 2008, the Fed greatly expanded the use of this tool as it tried to fight the financial crisis, accepting as collateral for repos some of the assets that banks would have had trouble liquidating in that environment. By 2009, this intervention by the Fed was no longer needed, and Fed repos were essentially nonexistent between 2009 and last September.
(Click on image to enlarge)
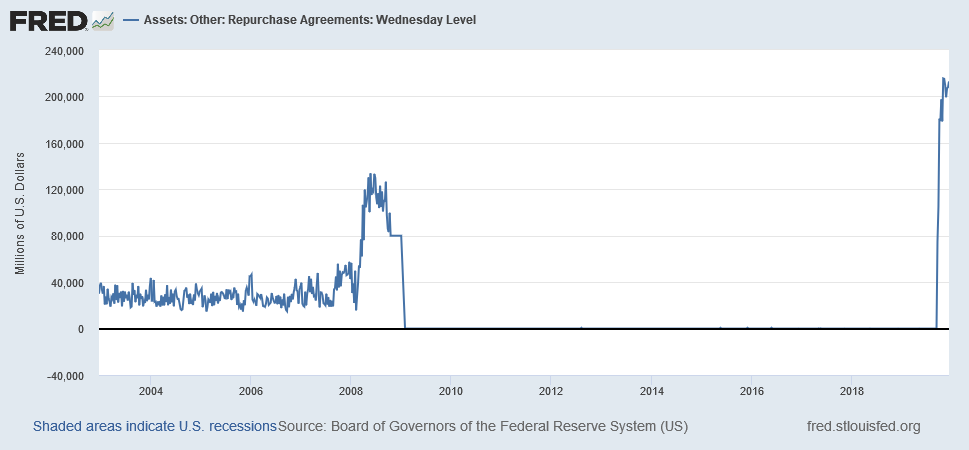
Federal Reserve repurchase agreements in millions of dollars, Wednesday values, Dec 18, 2002, to Dec 11, 2019. Source: FRED.
Was the large-scale resumption of these operations last fall a response to some fundamental new distress in the financial system? It may raise some concerns, as I comment below. But the biggest issue it highlights is a point I raised in a recent paper: the Fed currently lacks precise tools for achieving its primary policy objectives.
Since 2014, the Fed has announced its objective in terms of a target for the fed funds rate, which is an interest rate on overnight loans between depository institutions. The Fed has framed its objective in terms of upper and lower bounds within which it wanted the fed funds rate to trade. That worked for a while. But last September the funds rate spiked above the Fed’s intended range.
(Click on image to enlarge)
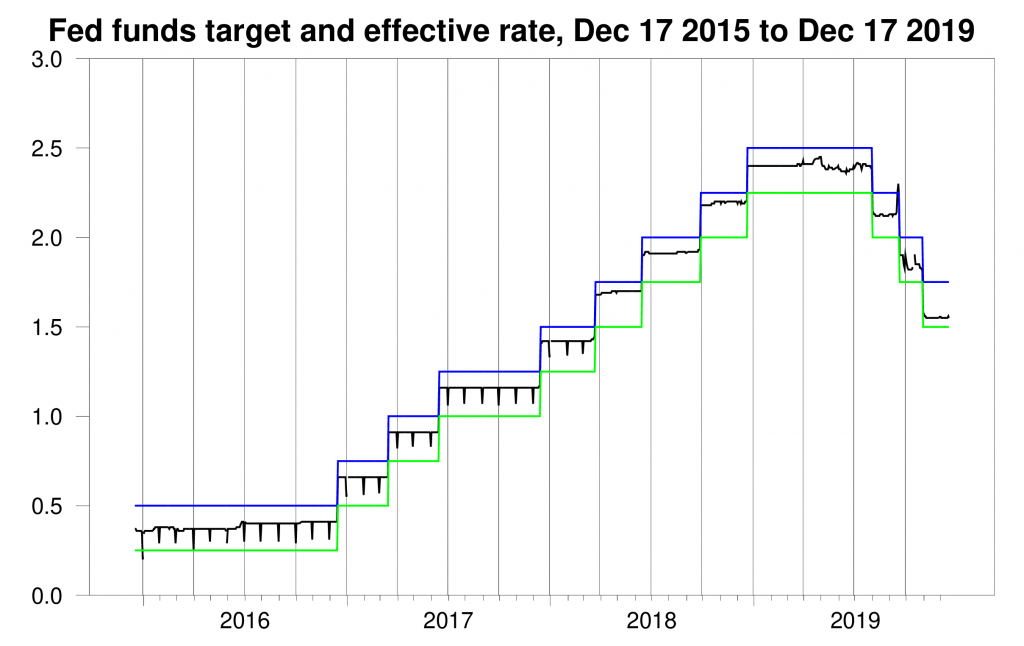
Effective fed funds rate and upper and lower bounds of the Fed’s target range, daily Dec 17, 2015, to Dec 17, 2019.
What happened? I predicted this in the paper I wrote last May. You can watch a video of my presentation on YouTube. The basic issue is that while the Fed has been announcing at each meeting an upper target for the fed funds rate, there was nothing guaranteed by its specified policies that prevented the fed funds rate from trading above the target. For a while, some might have thought that the interest rate the Fed pays on excess reserves (IOER) functioned something like an upper bound. After all, up until the middle of 2018, the fed funds rate was always below IOER and in fact, the Fed always specified the identical number for IOER and its upper target. When the funds rate began to nibble around the value of IOER, the Fed simply raised the number it announced for the target above IOER. But the target itself was just an announcement — there was no automatic procedure to ensure that the goal would be achieved.
(Click on image to enlarge)
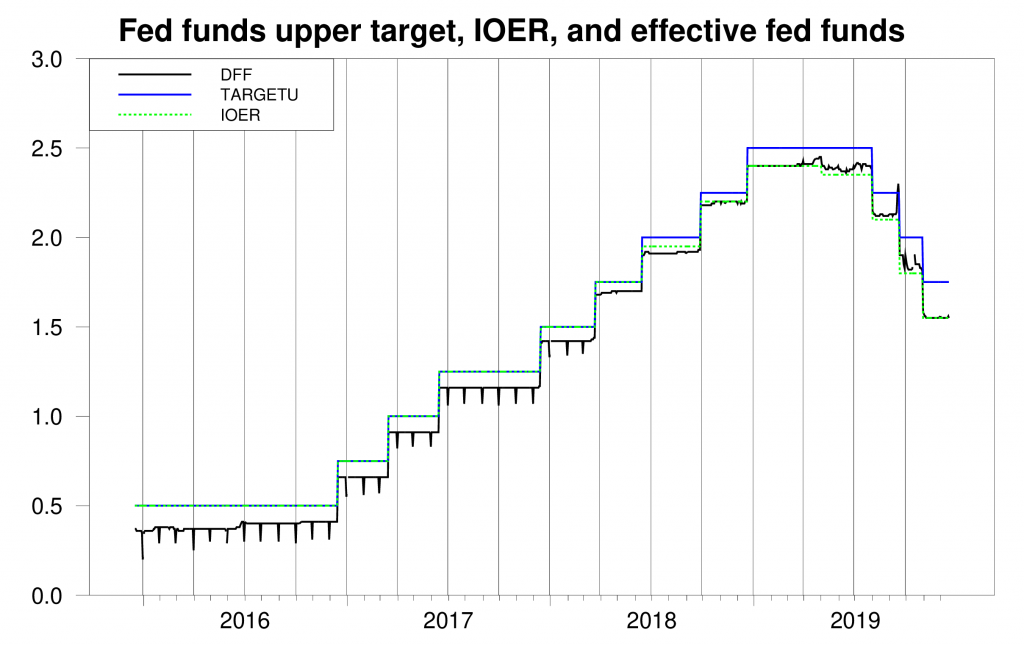
Effective fed funds rate, upper bound of Fed’s target range, and interest rate paid on excess reserves, daily Dec 17, 2015, to Dec 17, 2019.
So what was holding the fed funds rate down, if not IOER? In my paper, I argued that there were two factors. First, low investment meant limited demand for borrowing, and second, the huge volume of excess reserves in the system was helping keep rates down. I suggested that demand for borrowing was picking up, in part perhaps due to the U.S. Treasury’s need to finance the big deficits, changing the first fundamental. More attractive rates for short-term lending were pulling lending from depository institutions away from fed funds and into other instruments like tri-party repos and general collateralized finance. Rates on these often spike near the end of a quarter due to window-dressing — lenders don’t want to acknowledge who their counterparties are to stockholders or regulators, so they refuse to lend on certain dates. In September those spikes were big enough to bring the fed funds rate up with them.
(Click on image to enlarge)
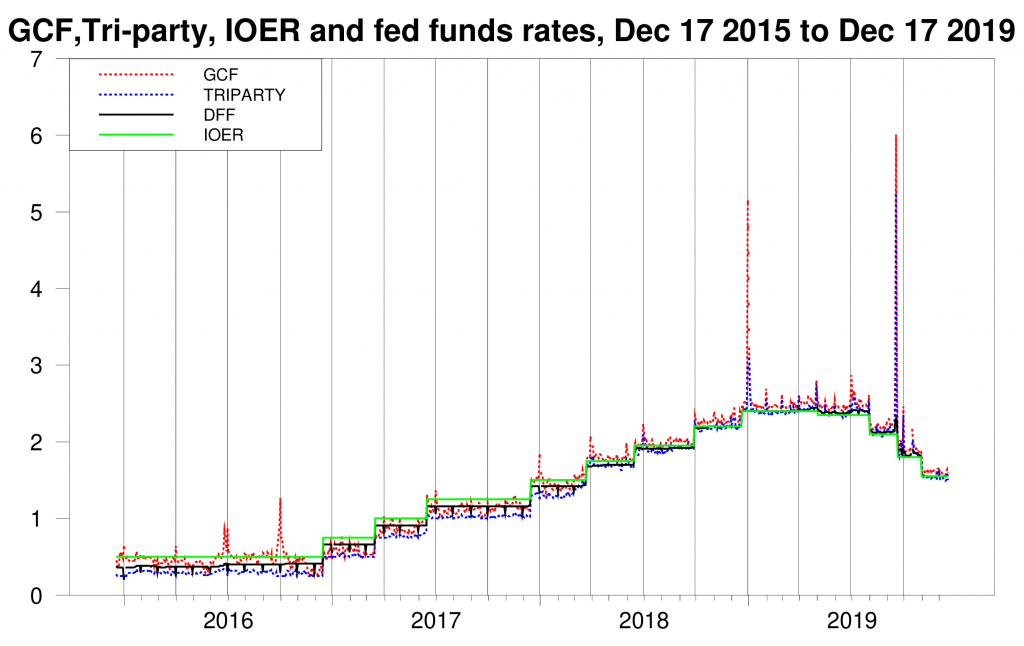
Daily general collateralized finance rate, for repurchase agreements collateralized by Treasury securities (dashed red), rate on tri-party repurchase agreements collateralized by Treasury securities (dashed blue), interest on excess reserves (green), and effective fed funds rate (black), Dec 17, 2015, to Dec 17, 2019. Vertical lines mark the end of quarters.
The Fed’s response to this development was to address the second factor I mentioned above, namely, flood banks with even more excess reserves. This was the main objective of the security purchases and the repos. The following graph shows the asset side of the Fed’s balance sheet. Repos and new purchases of T-bills brought total Fed assets up by $334 B over the last 15 weeks.
(Click on image to enlarge)
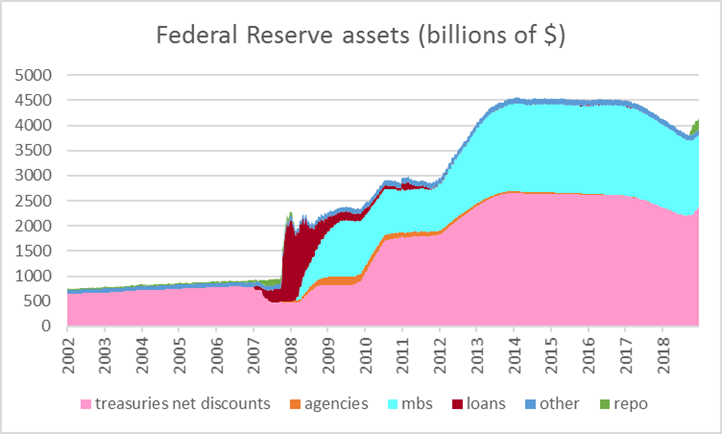
Federal Reserve assets, Dec 18, 2002, to Dec 11, 2019, Wednesday values in billions of dollars. Treasuries net discounts: U.S. Treasury securities held outright plus unamortized premia minus unamortized discounts. MBS: Mortgage-backed securities held outright. Agencies: Federal agency debt securities held outright. Other: sum of float, other Federal Reserve assets, foreign currency denominated assets, gold, Treasury currency, and special drawing rights. Loans: sum of loans, net portfolio holdings of Commercial Paper Funding Facility LLC, Maiden Lane I, II, and III, net portfolio holdings of TALF LLC, preferred interests in AIA Aurora LLC and ALICO Holdings LLC, central bank liquidity swaps, and term auction credit. Repo: Federal Reserve repurchase agreements. Data source: Federal Reserve H41 archive.
Buying the T-bills and making the repos expanded the volume of excess reserves held by bank, as seen on the liabilities side of the Fed’s balance sheet.
(Click on image to enlarge)
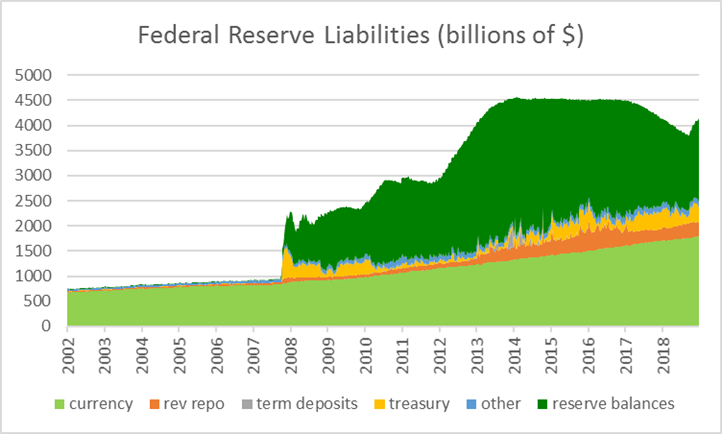
Federal Reserve liabilities, Dec 18, 2002, to Dec 11, 2019, Wednesday values in billions of dollars. Currency: currency in circulation. Rev repo: reverse repurchase agreements. Term deposits: term deposits. Treasury: U.S. Treasury general account plus supplementary financing account. Reserve balances: reserve balances with Federal Reserve Banks. Other: all other liabilities.
And exactly what level of reserves is needed to keep the fed funds rate always below the current upper target of 1.75%? Nobody knows. As I wrote in my paper,
the size of the Fed’s balance sheet is at best a very blunt instrument for influencing interest rates.
There is a way to use repurchase agreements to achieve a precise target. That is to specify an interest rate and offer to do an arbitrarily large volume of operations, whatever it takes to satisfy the demand. If the Fed operates on this basis, it puts an effective ceiling on the interest rate at which any counterparty that is eligible to participate in the facility would borrow. Why pay more to borrow from a private counterparty when I can get all that I want from the Fed? That’s a workable system, as long as the Fed has full regulatory supervision over all the eligible counterparties. But this is not currently the case. And when it’s not the case, it’s hardly a recommended plan for the Fed to assume all private credit risks on its balance sheet, effectively providing the funds for every lending opportunity.
That last point raises a broader issue. We’re seeing a new manifestation of the shadow banking system and its potential instability. By shadow banks, I refer to institutions that follow the traditional model of banking, which is to borrow short and lend long. We understand well the vulnerability of such systems to a sudden reluctance of lenders to roll over short-term debt, and we have strong regulations and guarantees in place for traditional banks to keep this from happening. But the private repo rates plotted above are outside this regulation, and their spikes (currently end-of-quarter events) raise some concerns.
My recommendation is that the Fed narrow the list of counterparties eligible for repos, offer to do an arbitrarily large volume of repos at a chosen policy rate, and resume the process of reducing the overall size of its balance sheet.
And keep a sharp eye on the shadow banking system.
Disclosure: None.


