
The Diminishing Contribution Of U.S. Government Spending To GDP
After visualizing how U.S. GDP has evolved since the first quarter of 1947, both with and without the contribution of the federal government and also state and local governments, we couldn't help but notice that the U.S. federal government's contribution to GDP in recent years was far below the amount of money that it spends.
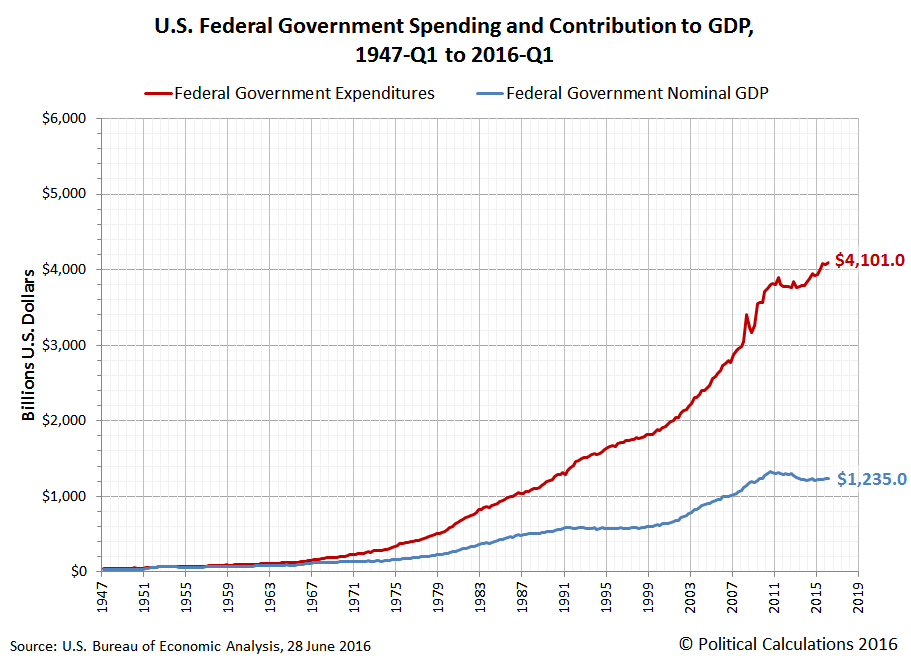
So today, we're digging deeper into the data and going the extra mile to illustrate the amount of federal spending that actually ends up going to a productive end, as determined by the U.S. Bureau of Economic Analysis. Our first chart shows the U.S. government's nominal total spending along with the nominal amount the BEA indicates contributes positively to the nation's Gross Domestic Product.
(Click on image to enlarge)
In our next chart, we've calculated the percentage of GDP that is generated for every dollar of the U.S. federal government's spending for each quarter from 1947-Q1 through 2016-Q1.
(Click on image to enlarge)
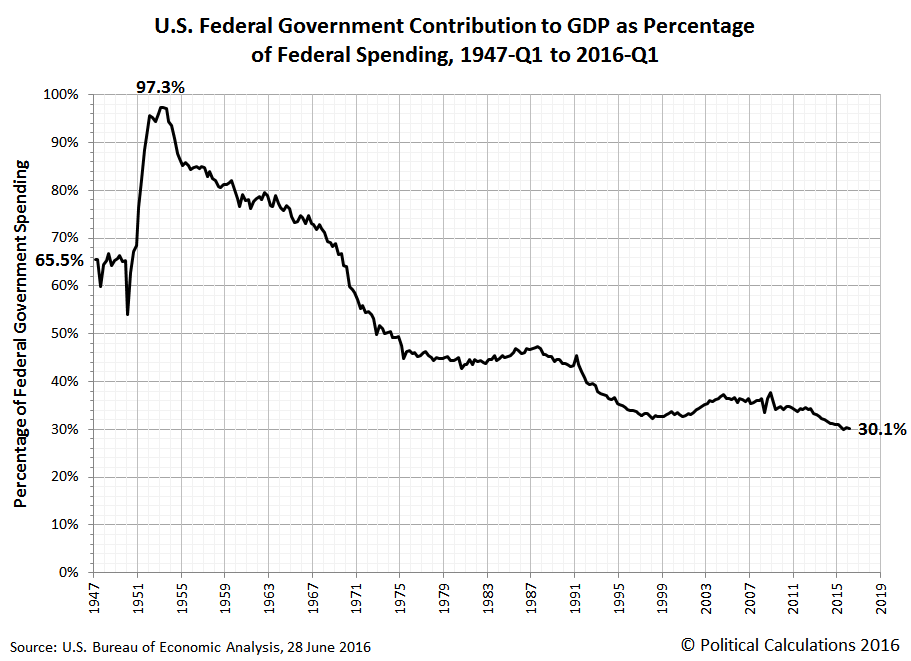
Over this period, we see that in the years immediately following World War 2, around 65% of the U.S. government's spending added to the nation's GDP. After briefly dipping in 1950, the U.S. government became a powerhouse contributor to the nation's GDP in the 1950s, as it began rebuilding the U.S. military and launched the U.S. interstate highway system, where suddenly, as much as 97.3% of the U.S. government's spending contributed to the nation's productive output.
After that initial surge, the contribution of U.S. government spending to GDP began declining. Slowly at first, it declined steadily to 74.8% in 1967, after which it began to deteriorate much faster, plunging to 44.8% in 1975, as the U.S. government implemented the Medicare and Medicaid welfare programs. Although it leveled out somewhat after 1975, it continued declining until bottoming in 1981 at 42.8%.
From 1981 through 1988, federal government spending made a more positive contribution to the nation's GDP, rising to 47.3%. This period coincides with a period in which the U.S. military was modernized and expanded.
But in the decade that followed, the contribution of the U.S. government's spending to the nation's GDP began diminishing again, falling to 32.3% in 1999, as the U.S. military shrank following the end of the Cold War, holding at that level through 2001. It then briefly rose to peak again at 37.2% in 2005, largely due to the aftermath of the 11 September 2001 terrorist attacks the subsequent expansion of the U.S. military to fight wars in Afghanistan and Iraq. After 2005, it held mostly flat through 2008, varying with military actions overseas.
After 2008 however, the U.S. government's spending contribution to GDP resumed its downward trend, falling to 30.1% through the first quarter of 2016, where now, just over 30 cents of every dollar spent by the U.S. government adds to the nation's GDP. During this period, U.S. military spending has been sharply reduced, while at the same time, additional government spending was devoted to expanding the Medicaid welfare program and subsidizing health insurance through the Affordable Care Act, which the BEA's GDP data suggests does not positively contribute to the growth of the U.S. economy.
We find then that over the last 60 years, the U.S. government has gone from a period where it was a powerhouse contributor to the nation's economy, where nearly every dollar it spent boosted the economy, to one in which nearly 70 cents of every dollar it spends is not considered to add to the productive output of the nation.
Disclosure: None.


