
The January Trade Deficit saw a slight increase compared to December, coming in at -$68.3B vs -$67.2B in the prior month. After peaking at -$106B in March of last year, the Trade Deficit has returned to a more stable range between -$60B and -$80B.
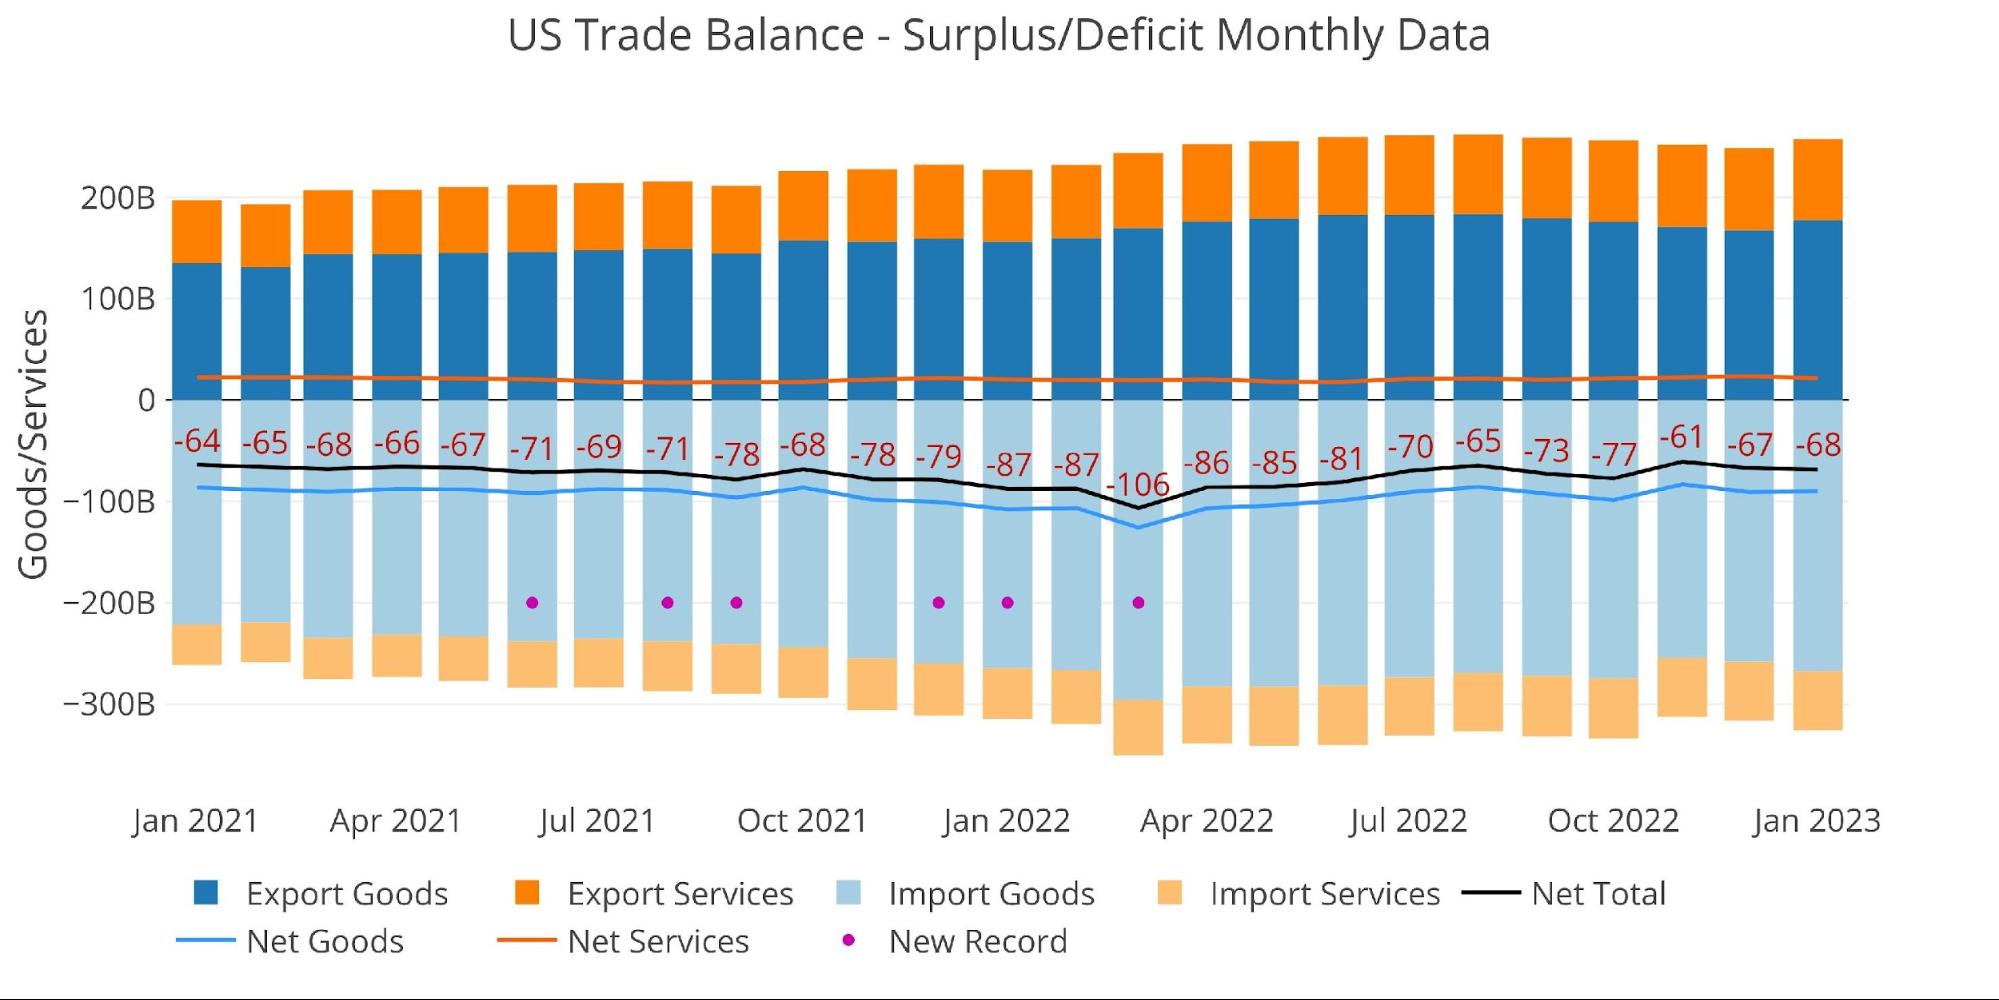
Figure: 1 Monthly Plot Detail
The table below provides detail.
Monthly Trade Deficit
-
- The Services Surplus fell $1.7B or 7.3% MoM
-
- This was driven on both sides, a fall in Exported Services of 2% and an increase in Imported Services of 0.2%
- It was still up from the print last January of $20.4B, driven by a big surge in Exported Services of 12.5%
-
- Goods Deficit fell slightly even though both Imports and Exports saw huge increases of 3.7% and 6% respectively. Exports were growing faster than Imports driving the 0.7% reduction
- The Services Surplus fell $1.7B or 7.3% MoM
Looking at Trailing Twelve Month:
- Exports and Imports have grown significantly over the last year, increasing 17.6% and 14.8% or $460B and $550B
- This kept the TTM deficit above $920B, up 6.6% from last year
Surging Imports and Exports could be the signal of a strong global economy or one that is facing extremely high inflation. Inflation likely continues to be the major driver behind such large moves in the Import/Export values published each month.
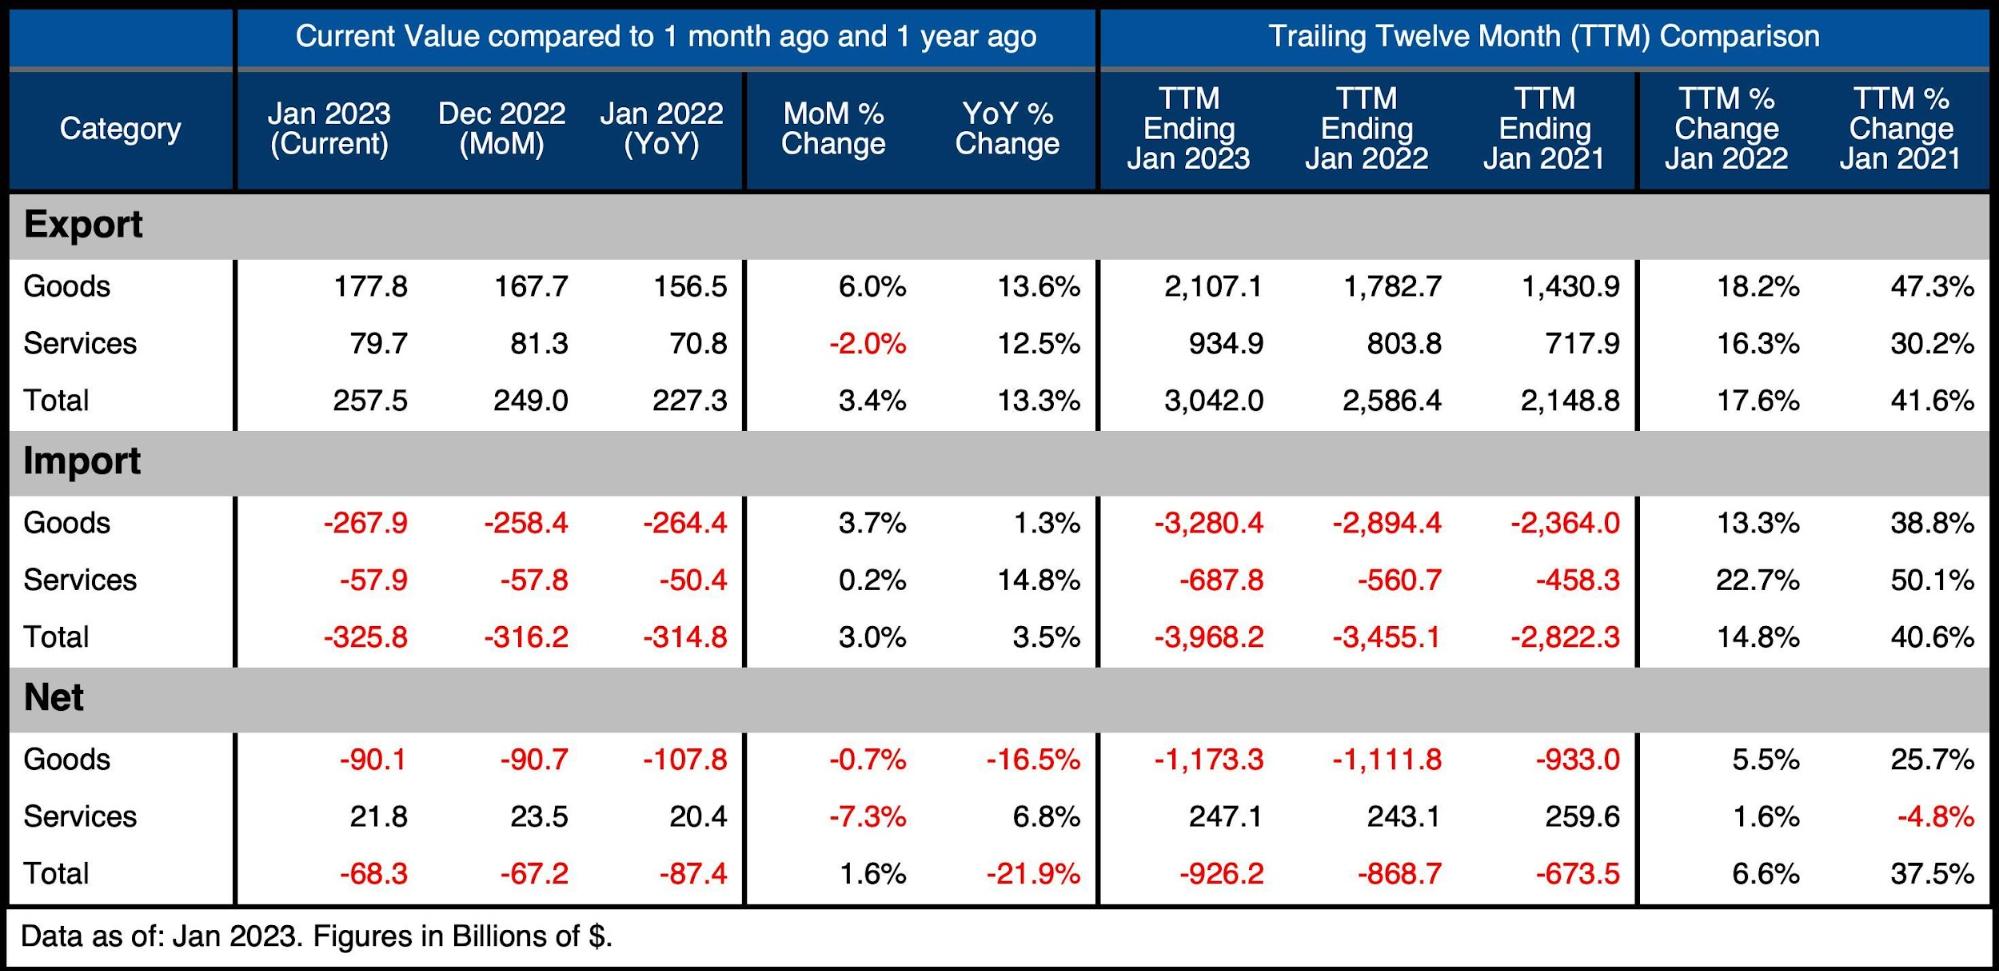
Figure: 2 Trade Balance Detail
Historical Perspective
Zooming out and focusing on the net numbers shows the longer-term trend. We are well off the lows seen last March, but the volatility has increased dramatically. The slight recovery in Net Services can be seen below after a long downward trend that began in late 2017.
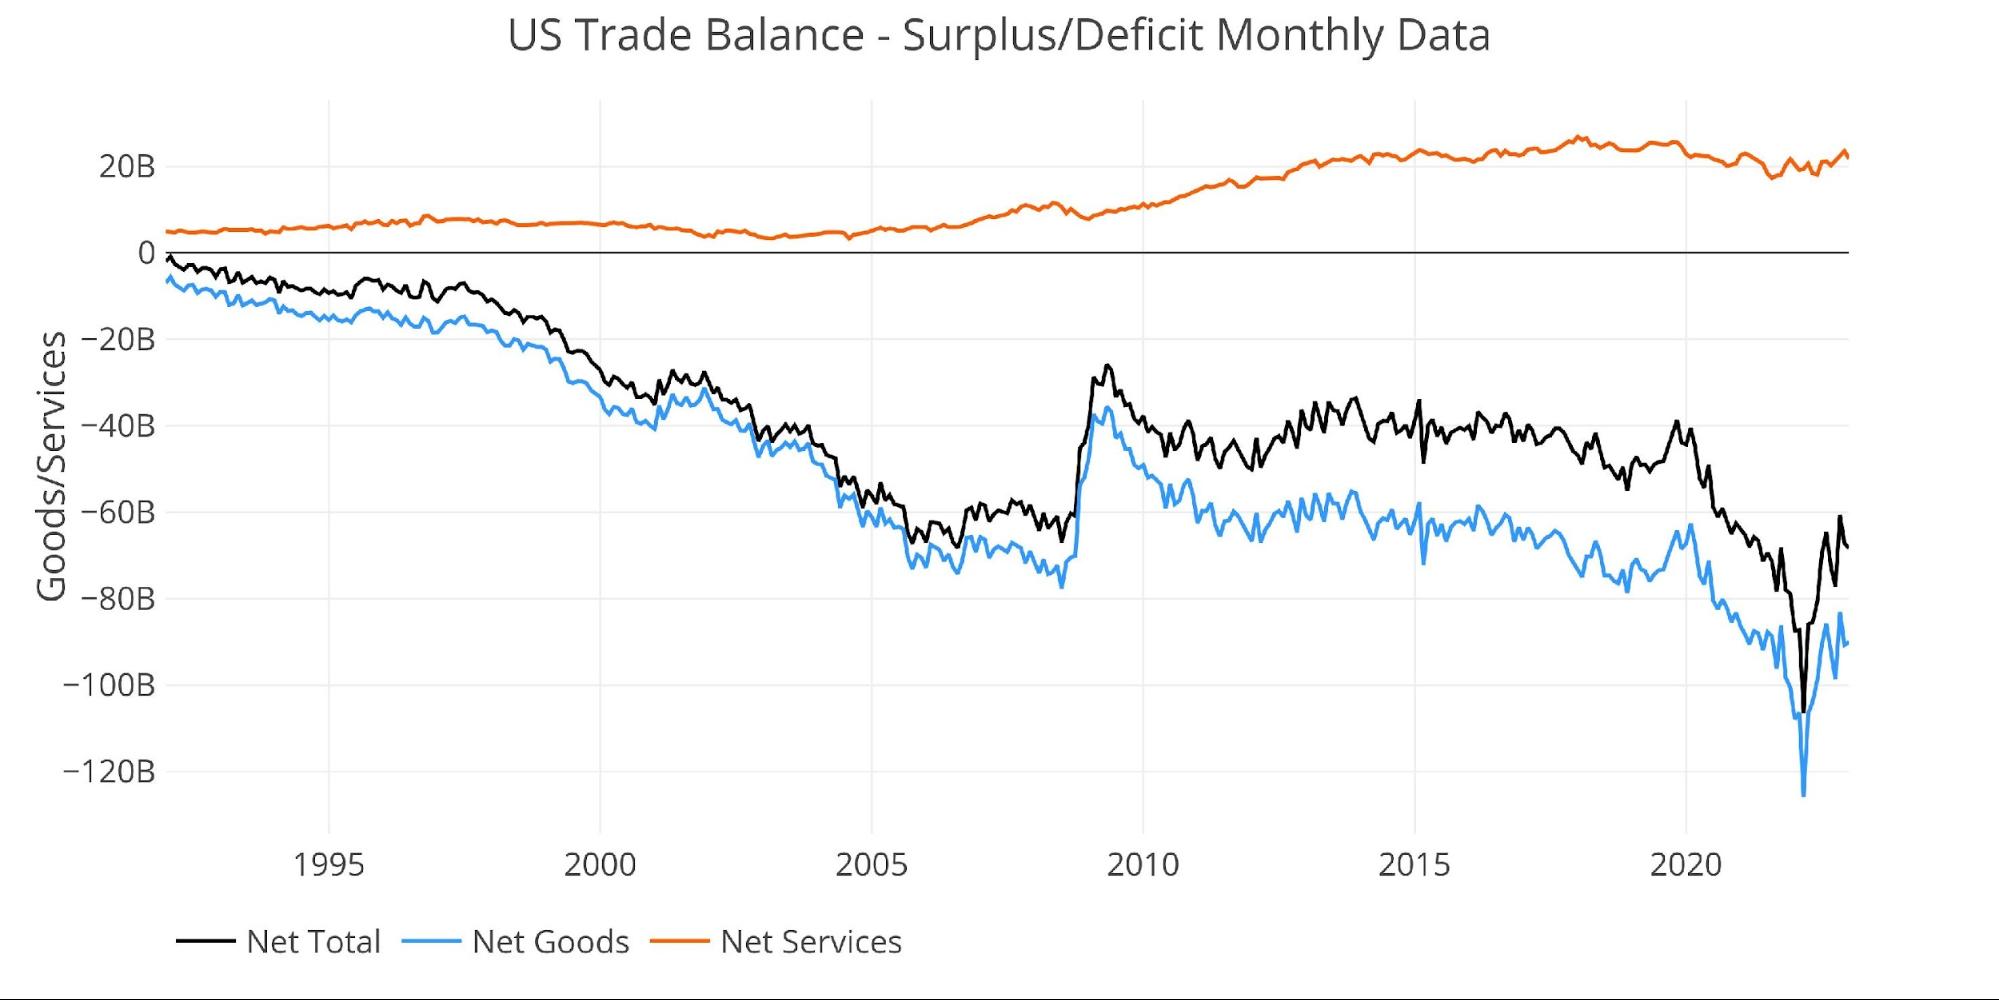
Figure: 3 Historical Net Trade Balance
That said, despite the recent recovery, the Services Surplus is still trending in the wrong direction. The chart below shows that Net Services continue to fall as a percentage of total Exported Services. This indicates that a tailwind could slowly become a headwind if the Surplus were to ever become a Deficit.
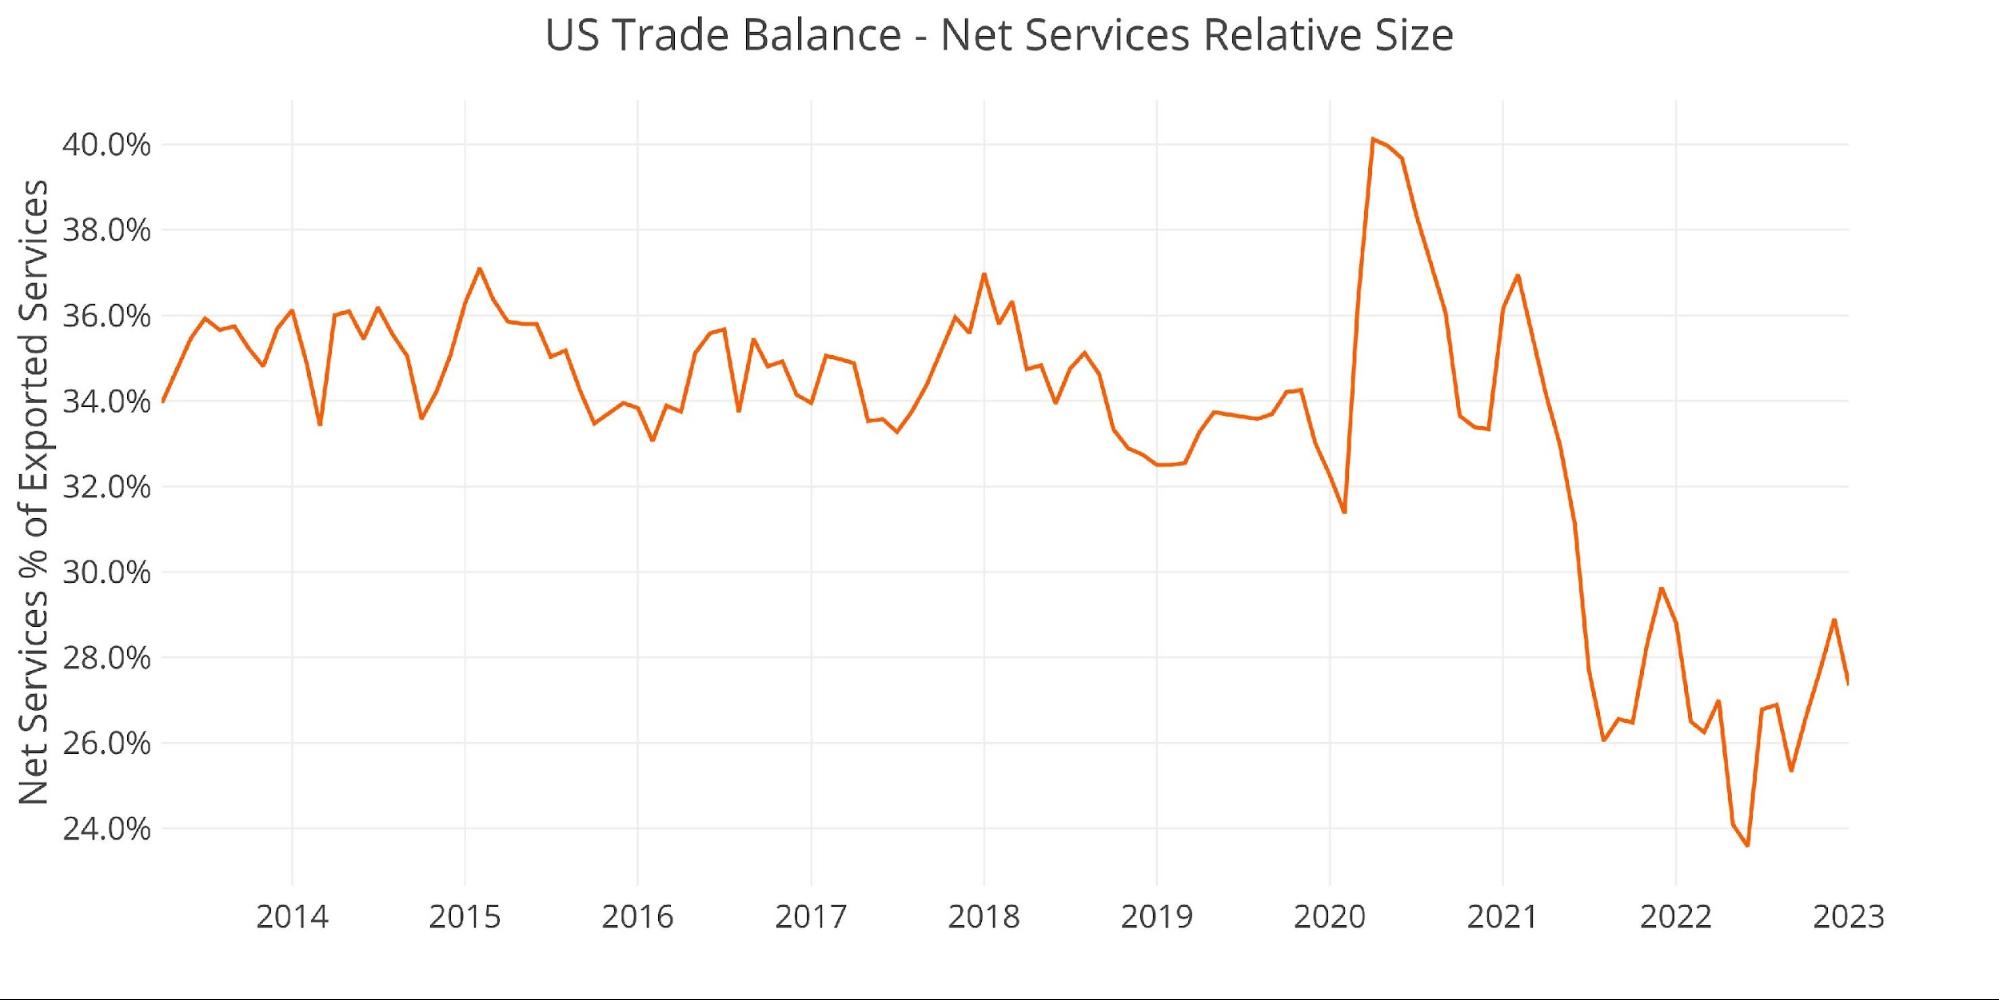
Figure: 4 Historical Services Surplus
To put it all together and remove some of the noise, the next plot below shows the Trailing Twelve Month (TTM) values for each month (i.e., each period represents the summation of the previous 12 months). The global surge in consumption is clear to see below, or, more likely, the global increase in prices.
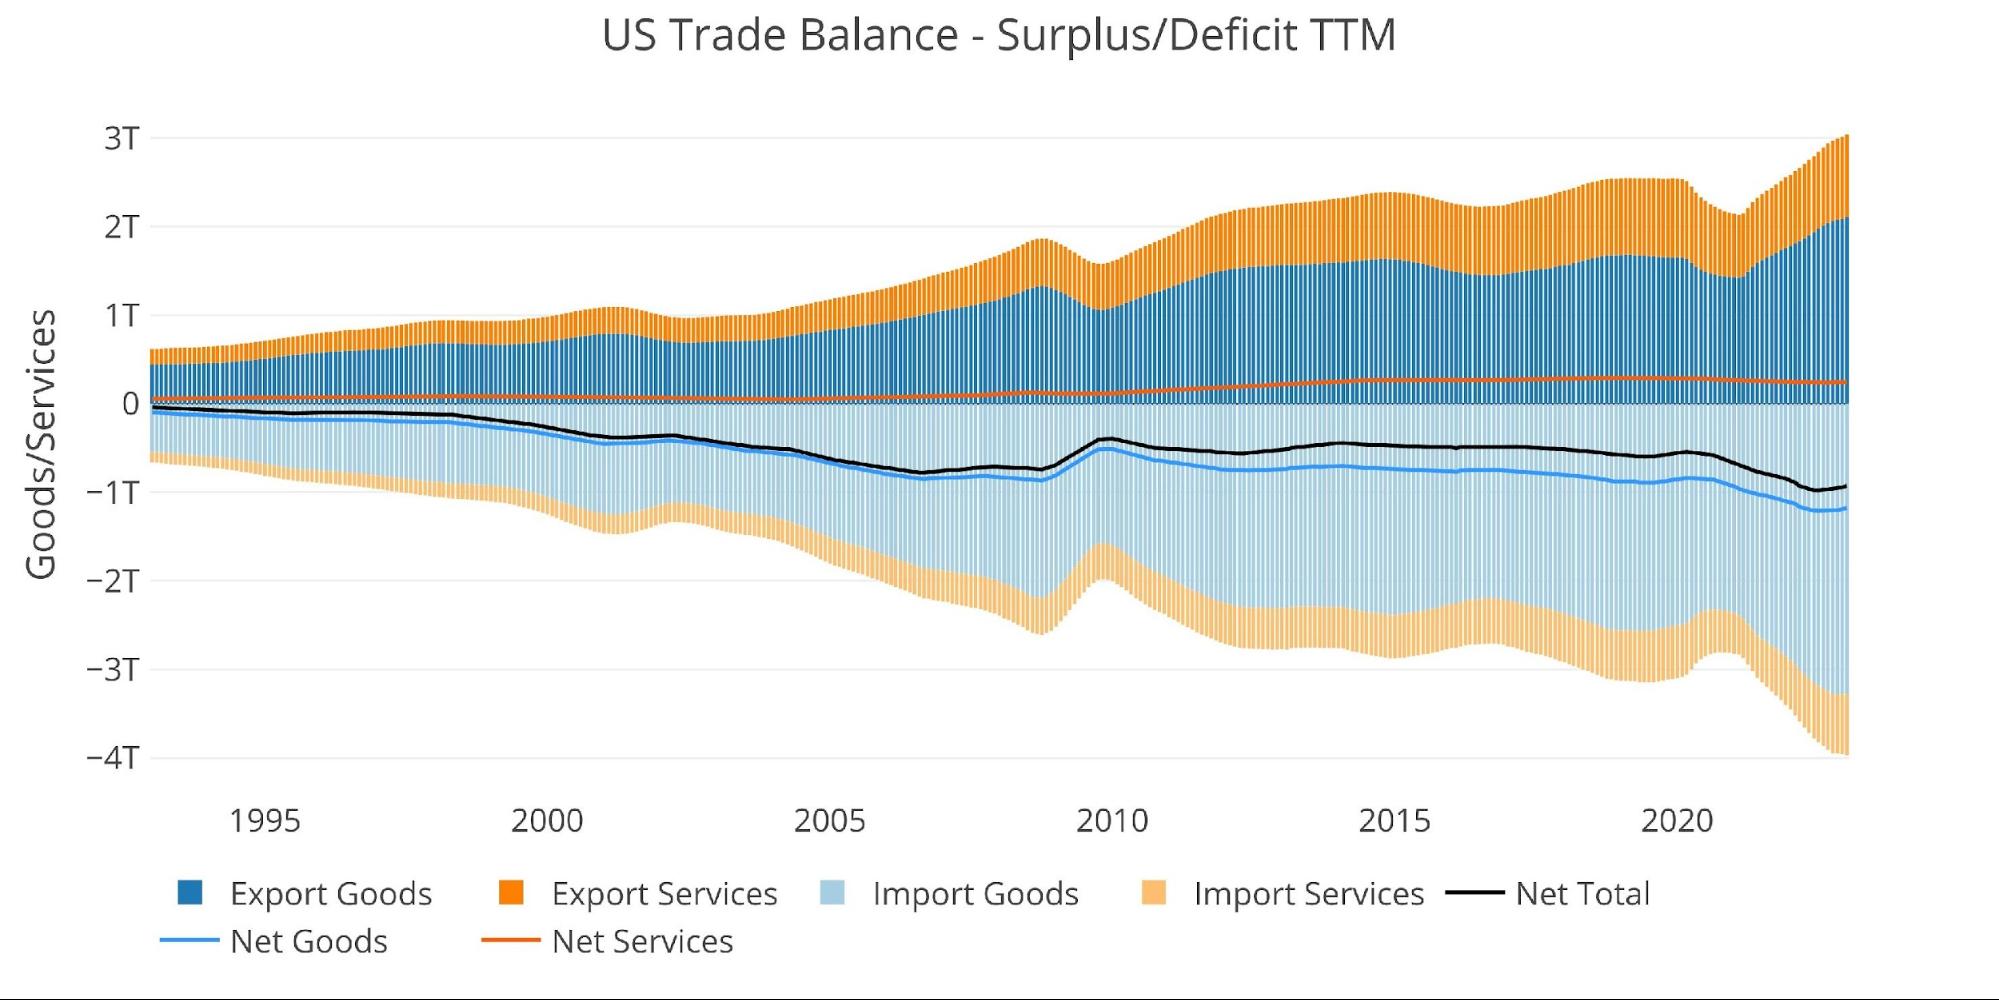
Figure: 5 Trailing 12 Months (TTM)
Although the TTM Net Trade Deficit is near historical highs, it can be put in perspective by comparing the value to US GDP. As the chart below shows, the current records are still below the 2006 highs before the Great Financial Crisis.
The current value of 3.54% is moving back down but is still well above the 2.5% from before Covid.
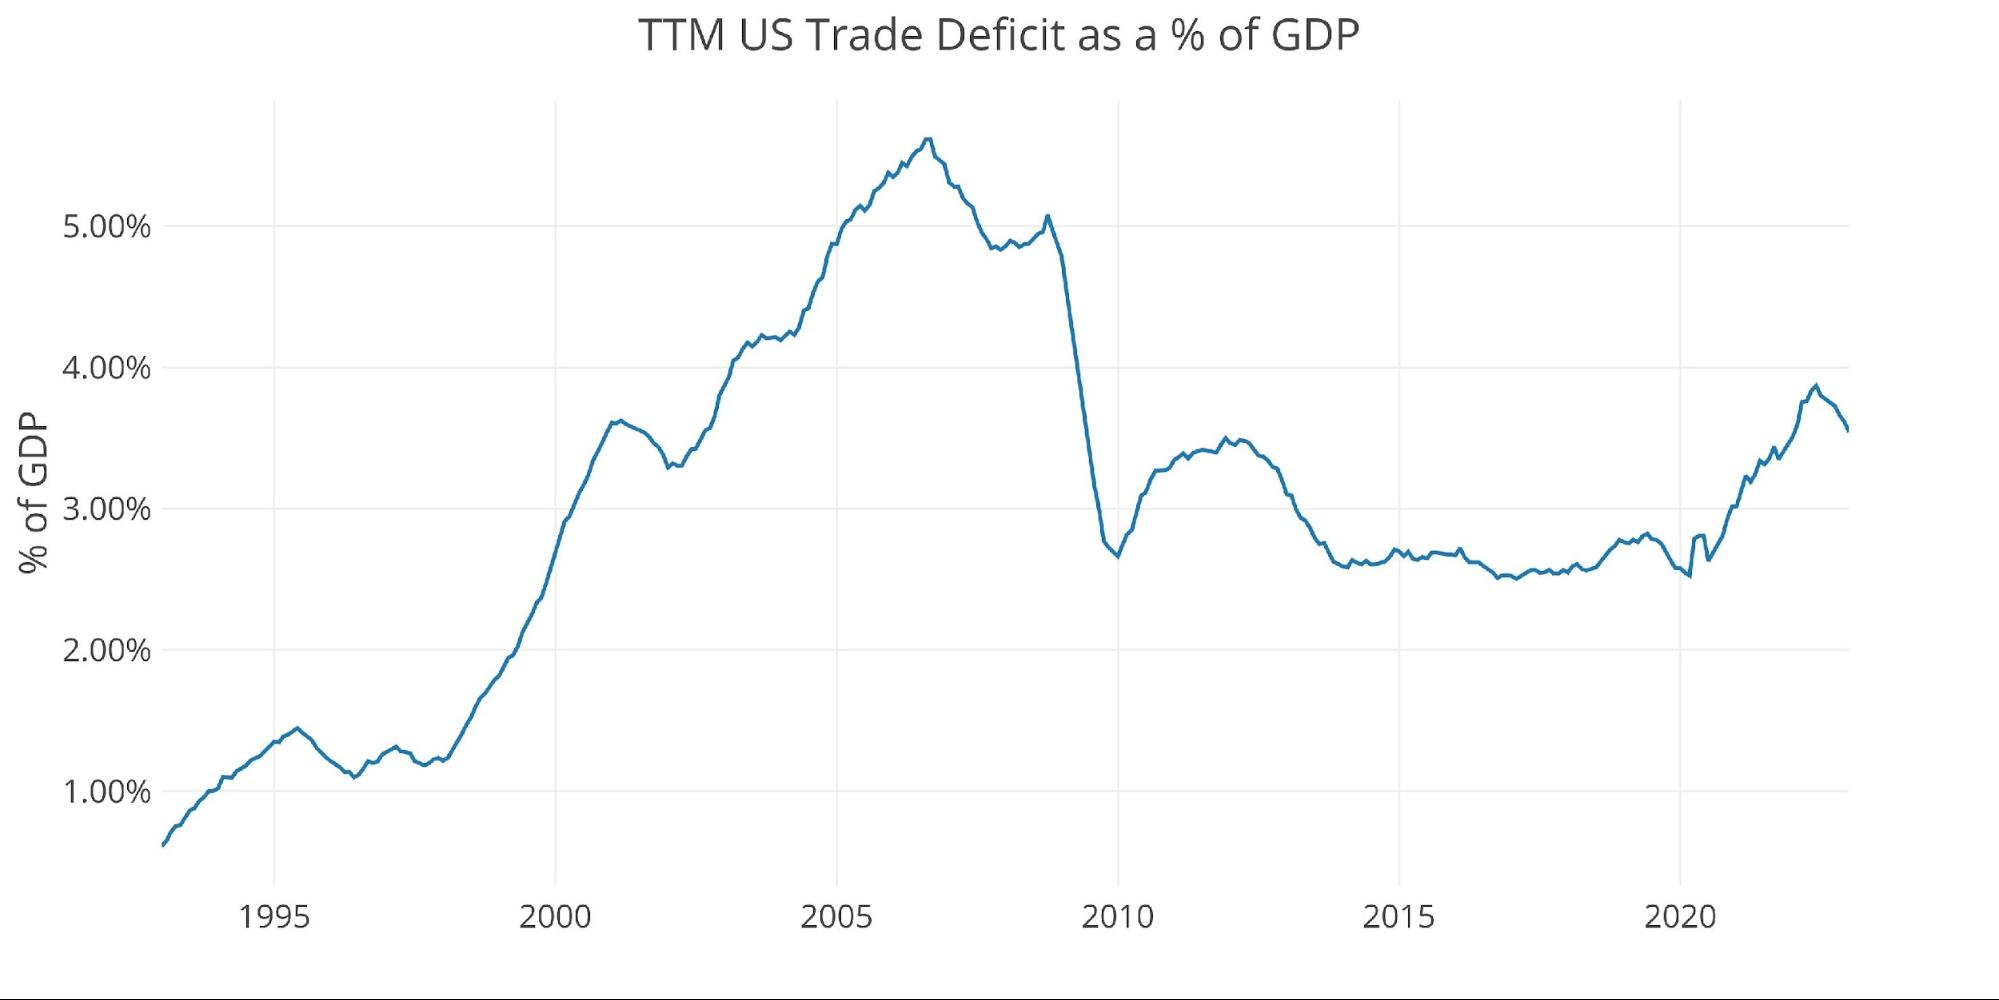
Figure: 6 TTM vs GDP
The chart below shows the YTD values. Because the latest month is January, this only shows a single month. It is clear to see how this January is larger in all categories than last January. Again, this is most likely attributable to inflation.
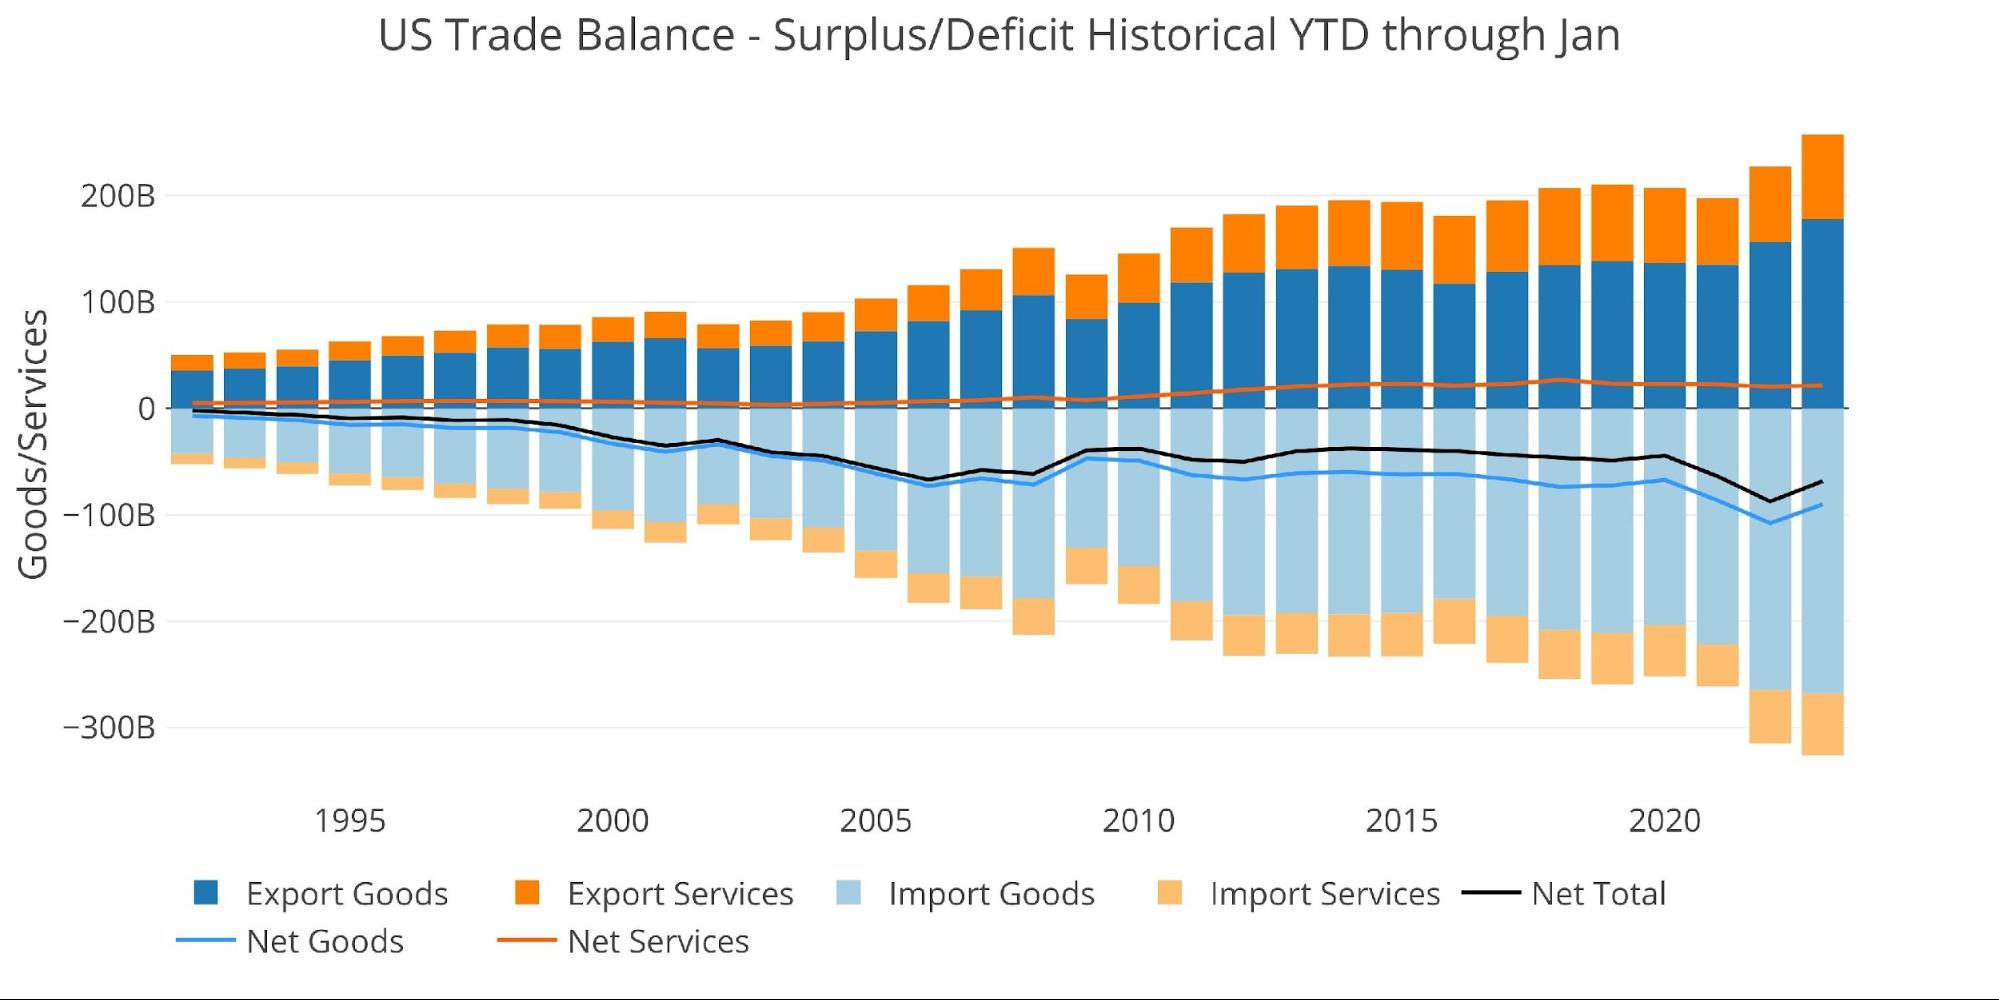
Figure: 7 Year to Date
Wrapping Up
The Trade Deficit is down from the records set last year, but the US is still printing very large Deficits. This means the US is still flooding the world with dollars in exchange for goods. For decades, the world has wanted dollars, but that could come to an end soon. India’s deal with Russia is another step along the path of the petro-dollar coming to an end. If the petro-dollar falls, then the rest of the world will be much less willing to absorb the dollars that have been printed at will for over a decade. Furthermore, those dollars could come rushing back to the US leading to a massive surge in inflation.
This is the worst-case scenario for the US but is also not a difficult scenario to imagine. It is better to be prepared for a crisis before it happens, which is why astute investors should be invested in assets to protect against such an event. The best assets to own in such an environment will be physical gold and silver.
Data Source: https://fred.stlouisfed.org/series/BOPGSTB
More By This Author:
Credit Card Borrowing Spiked In January Even As Big-Ticket Spending Slowed
Jerome Powell Performs Open-Mouth Operations; Markets Tank
Annualized Interest Up $230B Or 75% Since Last Year


Comments
Log in or sign up to join the conversation.