Real Median Household Income Is Another Measure That Smacks Of Recession
The Census Department notes that real (inflation-adjusted) median household income is down for three consecutive years.
(Click on image to enlarge)
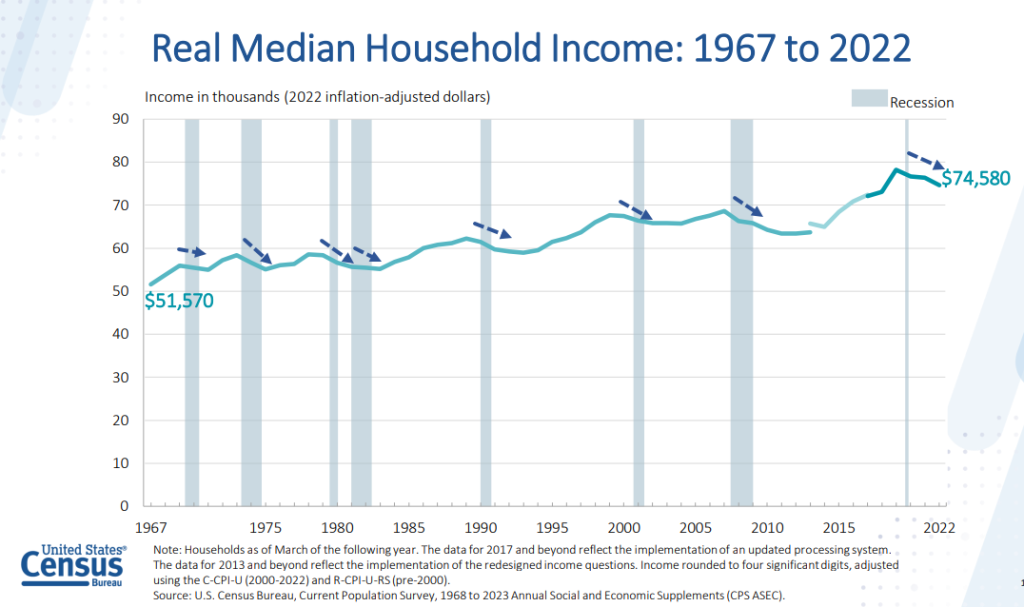
The data is very lagging, but please consider the Census Department Income, Poverty and Health Insurance Coverage in the United States: 2022, released on Tuesday.
Real median household income fell by 2.3% from $76,330 in 2021 to $74,580 in 2022. Income estimates are expressed in real or 2022 dollars to reflect changes in the cost of living. Between 2021 and 2022, inflation rose 7.8%; this is the largest annual increase in the cost-of-living adjustment since 1981.
The real median earnings of all workers (including part-time and full-time workers) decreased 2.2% between 2021 and 2022, while median earnings of those who worked full-time, year-round decreased 1.3%
When real median household income is negative multiple years, the economy is in recession or headed for one.
Real Incomes Down Third Year
(Click on image to enlarge)
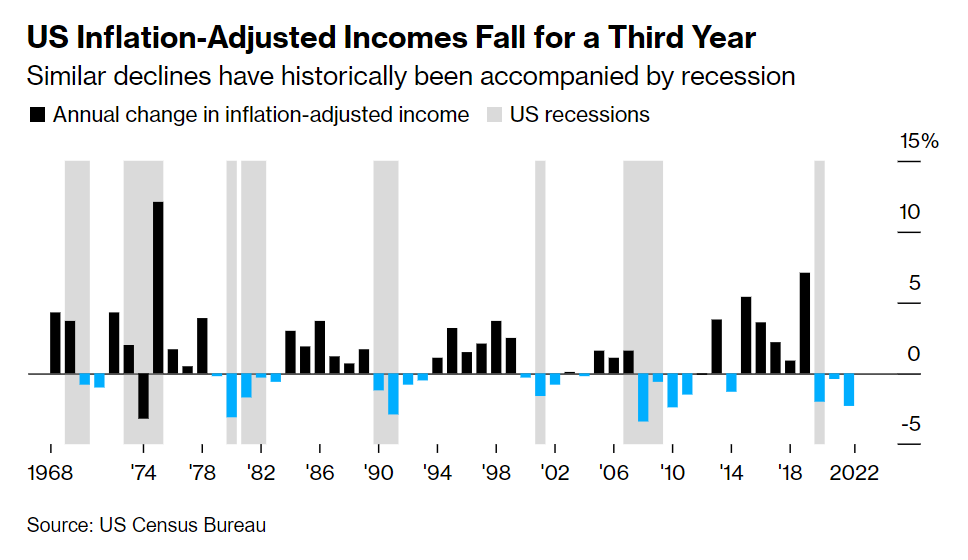
Real incomes are down for the third consecutive year as noted by the above chart from Bloomberg.
The report paints a concerning picture of the financial health of American families halfway through Joe Biden’s presidency. Even as the economy remains strong by many measures and inflation has cooled significantly from last year’s peak, it’s still proven a to be a political roadblock as Biden seeks a second term.
The figures also help explain why Americans have felt like they’re in a recession, even as the economy bounced back quickly from the initial Covid downturn. Hourly earnings have only just started to outpace inflation in recent months after lagging for two years, and measures of consumer sentiment remain well below pre-pandemic levels.
Real Median Household Income by Race
(Click on image to enlarge)
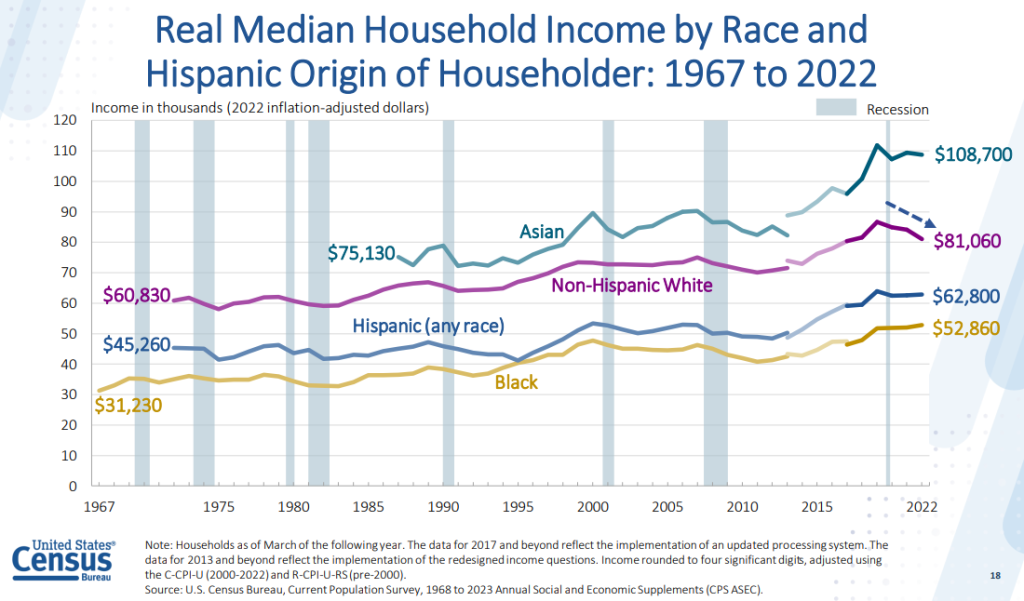
Non-Hispanic whites were hit the hardest.
Median Earnings by Sex
(Click on image to enlarge)
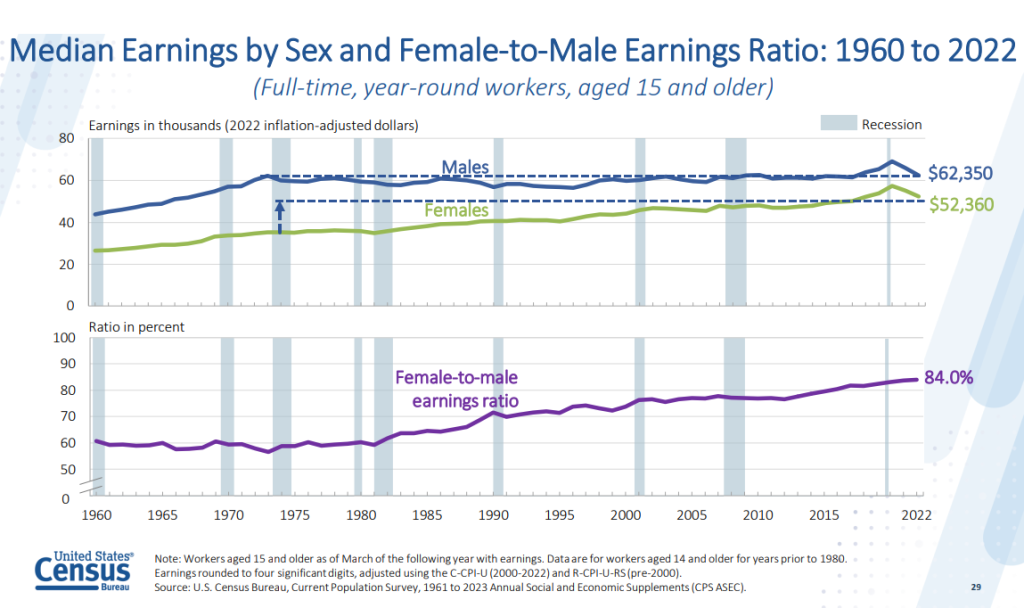
Men were hit much harder than women. The median male is making no more today than than 1973.
Women still lag men in earnings, but unless we see a comparison by job it’s impossible to make valid judgments on the true state of affairs.
Census Exposes Bidenomics
The Wall Street Journal comments The Census Exposes Bidenomics
You almost have to admire the brass of the Biden White House. The Census Bureau reported Tuesday that Americans are poorer under Bidenomics, and the President quickly changed the subject to blame Republicans for rising child poverty on his watch. As usual, too many in the press corps bought the spin.
Mr. Biden is trying to avoid the real story, which is that the Census Bureau says median household income adjusted for inflation fell last year by $1,750 to $74,580. It is down $3,670 from 2019. Households in the fourth income quintile—those making $94,000 to $153,000—lost $4,600 in 2022 and $6,700 since 2019. Middle-class Americans who think they’re losing ground are right.
Democrats passed their $1.9 trillion Covid bill in March 2021 with the goal of hooking the middle class on bigger government. But the big political surprise is that Americans weren’t thrilled with the handouts. A Hill-HarrisX poll in July 2021 found that 60% of voters, including nearly half of Democrats, thought the child tax credit expansion was too expensive and no longer needed.
Yet there Mr. Biden was on Tuesday lashing Republicans in Congress for not extending the expanded the child tax credit.
Mr. Biden has apparently forgotten that Republicans didn’t control either branch of Congress in 2021 or 2022. West Virginia Democrat Joe Manchin blocked an extension of the expanded child tax credit because it was estimated to cost $1.2 trillion over a decade.
The annual census data tell the real story of Bidenomics: A gusher of unprecedented and unnecessary social-welfare spending helped to produce the highest inflation in 40 years that has made Americans poorer. The last thing Congress should do is heed Mr. Biden’s demand to do it all again.
None of this is surprising to me. Gross Domestic Income numbers have been flashing warning signs for several quarters.
Negative Revision to 2nd Quarter GDP, Huge Discrepancy with GDI Continues
On August 30, I commented Negative Revision to 2nd Quarter GDP, Huge Discrepancy with GDI Continues
(Click on image to enlarge)
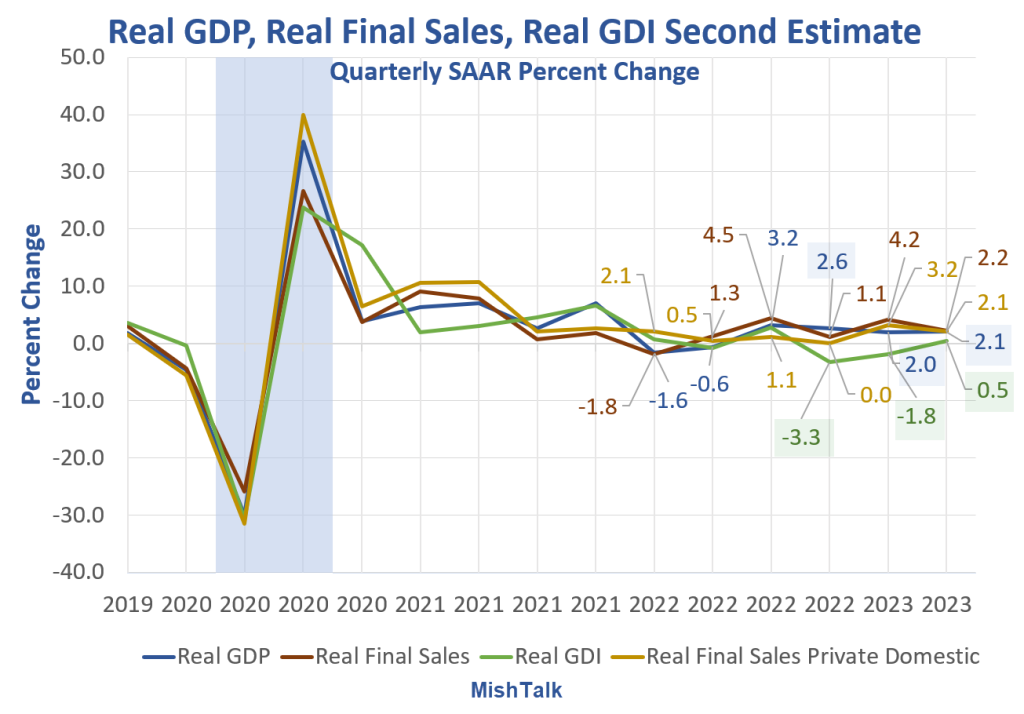
GDP numbers from the BEA, chart by Mish
GDP vs GDI Chart Notes
- Real means inflation adjusted
- GDP is Gross Domestic Product
- GDI is Gross Domestic Income
- Real Final Sales is the bottom line assessment of GDP. It excludes inventories which net to zero over time.
GDI was negative for two consecutive quarters and has been weaker than GDP for four quarters. GDI is now positive, but it is subject to greater revisions than GDP.
Two Measures of the Same Thing
Bear in mind that GDP and GDI are two measures of the same thing. Income should match products sold.
The last three quarters of GDP are +2.6%, +2.0%, and +2.1%.
The last three quarters of GDI are -3.3%, -1.8%, and +0.5%.
Philadelphia Fed GDPplus Measure Sure Looks Like Recession Started in 2022 Q4
(Click on image to enlarge)
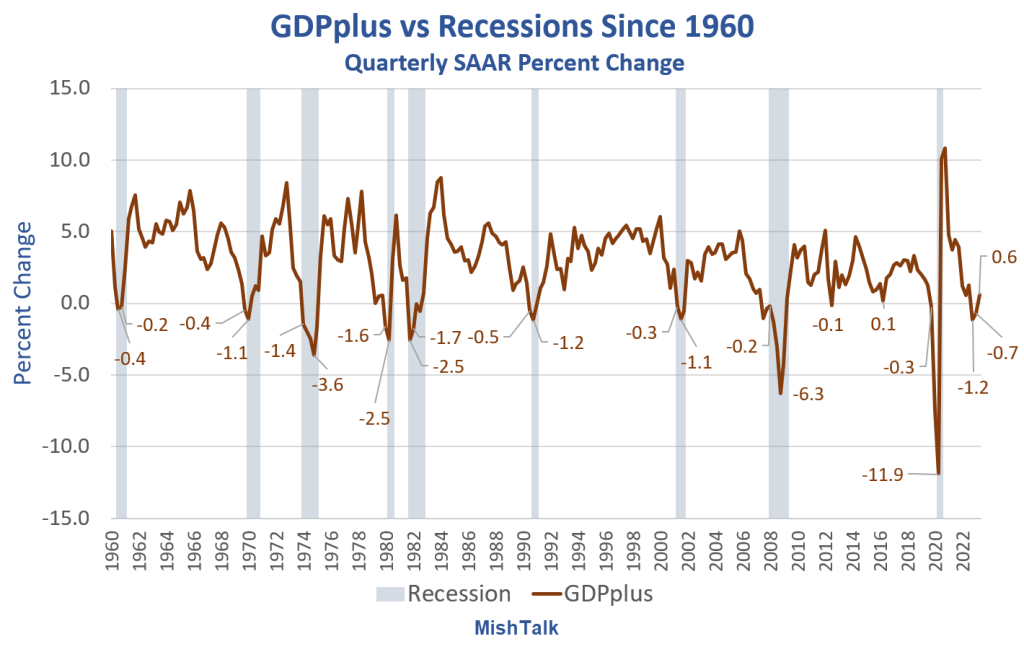
Data from Philadelphia Fed, chart by Mish
GDPplus is a measure of the quarter-over-quarter rate of growth of real output in continuously compounded annualized percentage points.
It’s a blend, but not an average, of Gross Domestic Product (GDP) and Gross Domestic Income (GDI). It is much smoother than either GDP or GDI as the above chart show.
In 100 percent of the cases, with no false signals, no misses, and no lead times more than two quarters, every time GDPplus had two consecutive quarters of negative growth, the economy was in recession.
And except for one negative print of a mere -0.1 percent, the economy was in or would soon go into recession as soon as the first negative GDPplus number surfaced, and stuck.
For discussion of the advantages of GDPplus, please see Philadelphia Fed GDPplus Measure Sure Looks Like Recession Started in 2022 Q4
People believe what they want and certainly Biden along with mainstream media is touting GDP.
The Census numbers are very lagging but match the idea that GDI is the set or numbers to watch.
More By This Author:
Workers Hammered By Inflation Again As Real Earnings Sink 0.4 To 0.6 PercentConsumer Price Inflation Jumps 0.6 Percent Led By Energy And Shelter
CVS And Cigna Charge $6,000 For $55 Generics, How Do We Fix This?
Disclaimer: The content on Mish's Global Economic Trend Analysis site is provided as general information only and should not be taken as investment advice. All site content, including ...
more


