
I have been running into comments about “top-down” versus “bottom-up” inflation analysis over the years, mainly on Twitter. The usual context is a conventional economist arguing that “bottom-up inflation analysis is defective” for some reason or another. I have not seen a long-form analysis justifying this, rather this was drive-by snark. I have seen this more often as people are taking victory laps for inflation forecasting.
Since I am not a huge fan of the people making the comments, I cannot offer a strong version of their views. I will instead offer a guess at what they were driving at, and explain why I think inflation analysis should be “bottom up.” (I discuss this in Section 3.3 of Breakeven Inflation Analysis.)
Vibes-Based Forecasting
The first thing I would note is that “vibes-based analysis” is not the way to go — but that does not stop a lot of financial commentators. If someone’s inflation analysis over the past few years was to argue that a few categories of the inflation index were the major contributor and that they would reverse, that’s vibes-based forecasting, not a model-based bottom-up inflation forecast. Someone might have good intuition and get a decent number of forecasts correct, but that is not particularly helpful — since there are a large number of vibing forecasters, at least some of them will get lucky with their forecasts. To the extent that the complaints refer to this “methodology,” I cannot loudly disagree.
(Although I am skeptical about mathematical modeling in macro, I am less skeptical about forecasting inflation over relatively short intervals, since it is a lagging economic variable. You might need to override your model if you know it is going to get hit by unmodelled factors, which is where intuition comes in.)
Top Down Approaches Are Doomed
A “bottom-up” model for inflation is straightforward to describe: it consists of attempting to build the best model for various components of the inflation index and then combining those forecasts to get an overall inflation forecast. Conversely, a “top-down” model is somewhat vaguer, it has to be an inflation model that is not a bottom-up model. Since we could just jumble together mathematical models into another model, it is a judgment call as to what meets that definition. Presumably, the model relies on aggregated macro data, like GDP growth, money supply, or whatever.
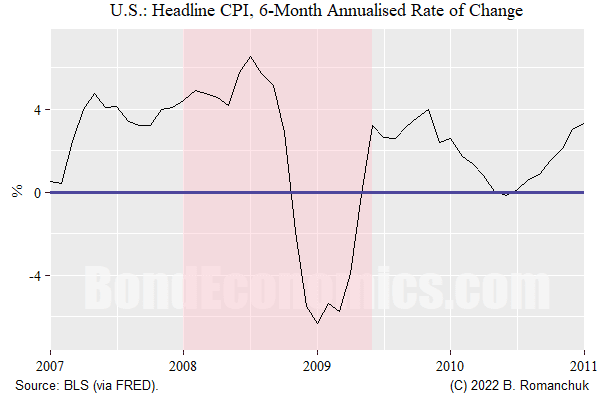
The chart above shows what a top-down model is up against — headline inflation can move rapidly. In 2007-2008 the 6-month rate of change of headline CPI accelerated, and then rapidly reversed after mid-2008.
Trying to explain that reversal with aggregated data is going to be a challenge, and even if one reverse-engineered a model to work in that episode, the model is likely to blow up elsewhere.
Of course, it is easy to see the problem: the spike and crash in inflation were due to an oil price spike that reversed.
The immediate response might be: well, just have a model for core inflation. However, as soon as you have done that, you have split the inflation index into components: core, and non-core. That is a bottom-up approach.
Longer Horizon Forecasts Will Be More “Macro”
In my discussion here, I am envisioning inflation forecasting on a six - to the twelve-month horizon. If we wanted to forecast inflation two years out, we might be stuck with a largely “macro” forecast. It is likely that models of sub-components might not be particularly good at that horizon. A poorly fitting model based on something like the projected output gap might be the best that you can do.
However, we need to keep in mind how questionable such forecasts are. Forecasting the current inflation situation in July 2020 would have been difficult, to say the least. Historically, such forecasts might have been okay during the low inflation period from 1992-2020, although there would probably have been misses around things like the Financial Crisis.
Different Prices Move to Different Drummers

Although breaking off energy prices is not too controversial (the exclusion of food is less obvious), even within the “core” we can see price tendencies that are obviously not generated by the same process. One of the more stark examples is given above: the education component of CPI versus recreation.
In order to see the underlying trends better, I divided both indices by total (headline) CPI, with the two series rebased to 100 in January 1994. This could be interpreted as the sub-index “in real terms.”
We see that Education took off versus the average, whereas Recreation has underperformed. This is due to well-known forces. Education costs have ballooned, supported by government support of student loans. Although there has been an influx of pointy-headed MBA’s into higher education, their main contribution was to ramp up expenses and charitable fund-raising. Conversely, Recreation includes things like televisions, where quality-adjusted prices have plunged due to technological improvements as well as the relentless deflationary pressure from overseas exporters.
More generally, one could attempt to draw a line between services and goods (“commodities” in CPI-speak), as goods are more exposed to international competition.
Another category that stands out is rents. Rents are generally determined in a market (modulo rent controls), and costs are independent of things like wages. (Utilities might move with energy costs.)
I would argue that we end up with at least five major categories to deal with.
- Energy and energy-related categories.
- Food, which might be split between processed/restaurant versus more volatile non-process categories.
- Rent/housing.
- Remaining services.
- Remaining goods.
However, this breakdown is somewhat arbitrary — the breakdown should be determined by your ability to model the components of the price index. It is quite likely that you end up with some sensible components with decent models, and then the “everything else” category, which hopefully has a small weight.
How Do You Model the Components?
Although I have disparaged “macro” models, they might sneak into the models of the components. The concern is that the components will have different mixes and weightings. Energy prices are largely determined in global markets (although the United States’ status as a major consumer made energy somewhat “domestic” historically.) Domestic services will not be affected by currency valuation changes. Rents presumably follow housing market indicators, as well as wages.
Wages are where “macro” makes its greatest comeback. One might hope to model wage growth based on labor market indicators (where there is a large economic literature of mediocre models that economists have strong opinions about). The relationship between consumer price inflation and wage inflation is somewhat irregular, so a wage-based model is going to be inferior for short forecast horizons, but might be justifiable for a medium-term forecast (e.g., 3 years out).
The largest potential issue I see for bottom-up approaches is the weighting they placed on the importance of wages, either explicitly or implicitly as a generic “macro conditions” factor is added to the various models. To what extent we might have seen surprises in the past year (putting aside energy costs) is presumably the result of wage growth. Models fit against the past few decades for inflation components might not have attached enough weight to wage growth, since wage growth was not particularly volatile.
Concluding Remarks
I have serious doubts that any model-based approach is going to work well historically and also capture the initial gyrations in the price indices after the pandemic shutdowns. (I see people cherry-picking explanatory variables and comparing them to the current inflation rate, which dodges the question of the track record of those cherry-picked variables.) Also, an economic model was not going to predict the Russo-Ukraine War. Instead, the concern is trying to explain the lack of (rapid) reversion towards 2% inflation (as “transitory” implied) in the core components of inflation.
Without pinning down particular models, we cannot make strong statements either way. My feeling is that the most likely point of failure would have been the importance of wage growth being underestimated. A model estimating non-energy service inflation is going to be related to wages, the problem is whether the variables chosen as inputs would capture the recent rise.
More By This Author:
Crypto And The Real EconomyTreasury Market Pricing
Fed Panics

Comments
Log in or sign up to join the conversation.