
New Home Sales Market Continues Deceleration
Roughly every three months, we check in on the overall state of the new home market in the U.S. by estimating its market capitalization, where we take the average prices of new homes sold in the U.S. and multiply it by the number of new homes sold each month, then calculating its twelve month average to minimize the effects of seasonal variation in the monthly data. The following animated chart shows the results of that math, both in nominal terms and adjusted for inflation, for the period from December 1975 through the preliminary data just reported for June 2018.
(Click on animated image to enlarge)
In nominal terms, the trailing twelve month average of the market capitalization of the U.S. new home market has been rising since our last report three months ago, but at a decelerating pace, where the preliminary data for June 2018 suggests that the trailing twelve month average of the new home market capitalization has stalled in June 2018, with the months of both May and June 2018 recording a market cap of $20.1 billion in new home sales. This data will be revised several times during the next several months, so that may not the final outcome once all the data is finalized, but it is safe to say that the rate of growth of the new home market in the U.S. has slowed.
Scanning the news, CoreLogic has reported that new home sales in California have dropped sharply in June 2018, deviating from the pattern in the rest of the U.S. during the peak summer home-selling season. The California Association of Realtors has indicated that sale prices in the state reached an all-time high.
Going back to the national data, the U.S. Census Bureau reports that median new home sale price for June 2018 continued a downward trend for recent months. The following chart shows the trailing twelve month average of median new home sale prices versus median household income, where the recent upward trend appears to have peaked in April 2018.
(Click on image to enlarge)

Although based on preliminary data, the recent decline of median new home sale prices has come while median household income has been increasing, where new homes have begun to back off of the peak they reached in February 2018 to become slightly more affordable in recent months.
(Click on image to enlarge)
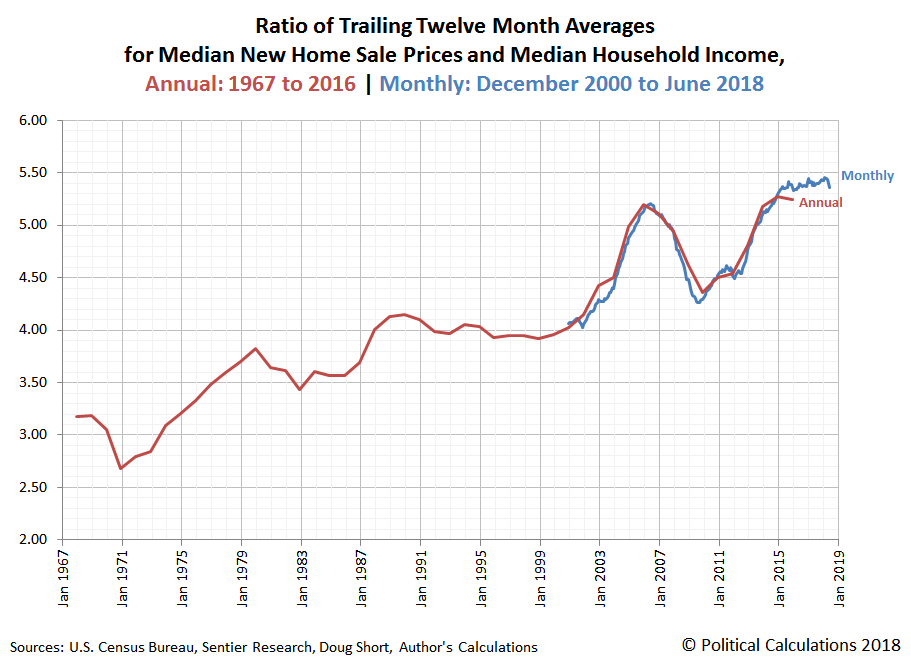
The ratio of the trailing year averages of median new home sale prices to median household income is however still elevated, with median new homes selling for just under 5.4 times the typical income of an American household in June 2018.
References
U.S. Census Bureau. New Residential Sales Historical Data. Houses Sold. [Excel Spreadsheet]. Accessed 25 July 2018.
U.S. Census Bureau. New Residential Sales Historical Data. Median and Average Sale Price of Houses Sold. [Excel Spreadsheet]. Accessed 25 July 2018.
U.S. Department of Labor Bureau of Labor Statistics. Consumer Price Index, All Urban Consumers - (CPI-U), U.S. City Average, All Items, 1982-84=100 [Online Application]. Accessed 25 July 2018.
Sentier Research. Household Income Trends: June 2018. [PDF Document]. Accessed 25 July 2018. [Note: We've converted all data to be in terms of current (nominal) U.S. dollars.]
Disclaimer: Materials that are published by Political Calculations can provide visitors with free information and insights regarding the incentives created by the laws and policies described. ...
more


Our thanks to TalkMarkets' editors for updating the article with the corrected version of the animated chart so quickly! [For those wondering what we're talking about, we had erroneously posted a version of the chart that only showed data through December 2017.]