
Multifamily Expenses Rise As Insurance, Other Costs Soar

Image Source: Pexels
Multifamily fundamentals have been stellar for nearly a decade, but rising expense costs are creating an ill-timed headwind just as rent growth is decelerating. Expenses for multifamily properties nationally grew by 9.3% on average in the trailing 12-month period ending in June 2023, which is 63% higher than the 5.7% increase during the previous 12-month period, according to Yardi Matrix expert data.
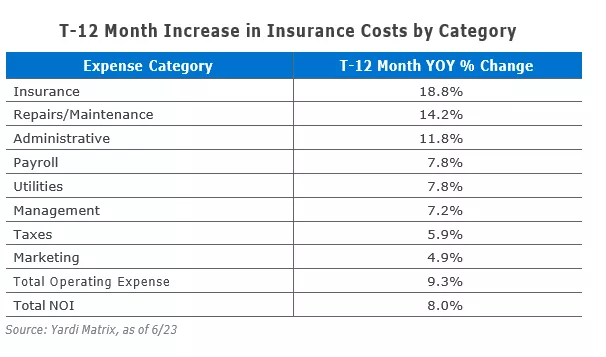
Expenses rose in almost every category, but the biggest increase was in insurance, which was up 18.8% on average in the 12 months ending in June 2023, per Matrix. Other expense categories with large jumps over the last year include repairs and maintenance (14.2%), administrative (11.8%), and utilities and payroll (both 7.8%). Perhaps surprisingly, taxes increased by only 5.9%. The increase in expenses in the period ending in June 2023 represents $740 in additional costs per unit at the average U.S. multifamily property, with the average property operating expense rising to $8,694 per year per unit, according to Matrix.
Rapid expense growth comes at an inopportune time for the industry. After a long bull market, asking rent growth has decelerated and is likely to remain weak in many metros as deliveries hit levels last seen in the 1980s. Also, the big jump in mortgage rates from the 3-5% range to the 6-9% range has produced a large increase in debt-service costs for properties that need new mortgages.
That said, it is important to keep the expense numbers in perspective. Operating expenses represent about 43% of gross income, according to Matrix, and income in recent years has grown more than expenses. Since the beginning of 2013, asking rents have increased 59% nationally. In the 12-month period examined for this report, net operating income increased by $838 per unit nationally, which is almost $100 per unit more than the increase in expenses.
That means most multifamily properties remain ahead of the game and most continue to perform well. Year-to-date through July in 2023, nearly 200,000 units had been absorbed, and rents were up a modest 1.5% through August. The national occupancy rate for stabilized properties is 95.0%, per Matrix, below cycle highs but solid by long-term standards.
Costs Rise Fastest In Southeast, Southwest
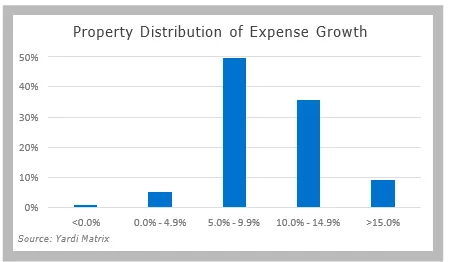
To get a handle on rising expense growth, Yardi Matrix tabulated expenses by category and geographic area by aggregating data on more than 20,000 properties with nearly 5 million units that use Yardi accounting software. This aggregated and anonymized “expert” data is available to Matrix clients. We broke down the increase in expenses in the trailing 12-month period ending in June 2023. The results found that expense growth was widespread, as operating expenses increased between 5.0% and 14.9% in 85% of U.S. multifamily properties in the last year, according to Matrix.
Total operating expenses increased by 9.3% on a trailing 12-month basis nationally. By category, insurance recorded the largest increase at 18.8%, followed by repairs/maintenance (14.2%), administrative (11.8%), payroll and utilities (both 7.8%), management (7.2%), taxes (5.9%) and marketing (4.9%). The rapid growth reflects national inflation trends, such as the increasing number of weather-related events that cause property damage, the tight labor market that is driving up employee wages, growing energy costs, and supply-chain issues that increase the cost of materials and appliances.
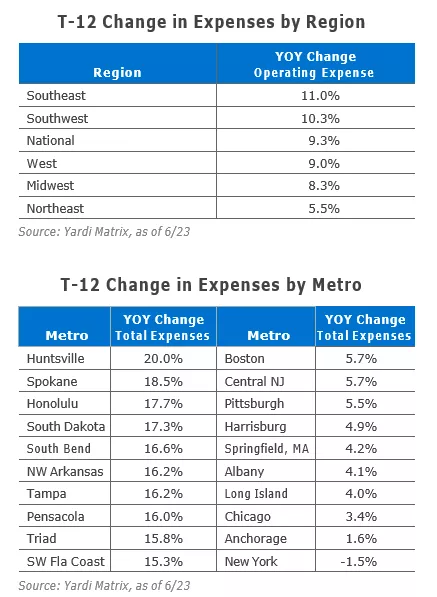
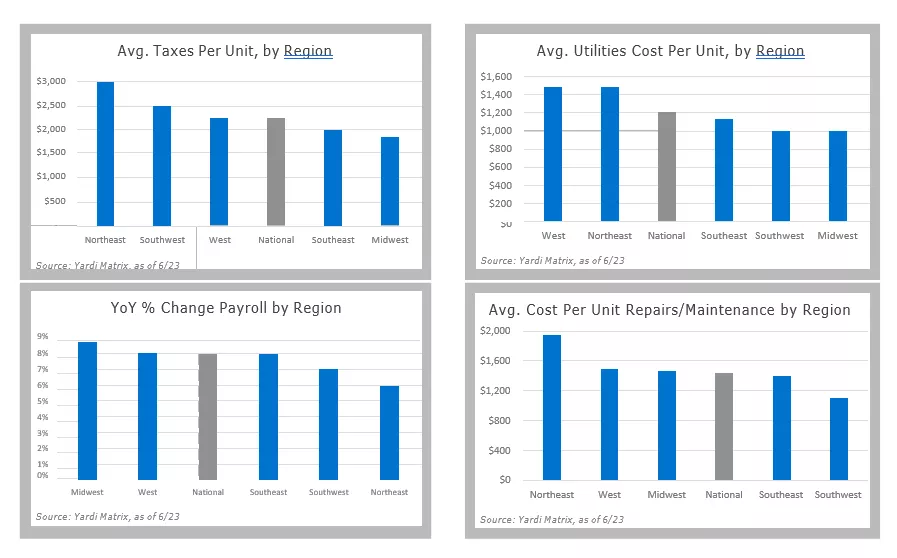
Regional multifamily expense growth reflected national inflation trends, as costs rose the most in rapid-growth regions, led by the Southeast (11.0%) and Southwest (10.3%). Expenses grew less rapidly in the West (9.0%), the Midwest (8.3%), and the Northeast (5.5%). Despite the increase, expenses remain lower in the regions with the highest year-over-year growth. Properties in the Northeast have the highest expenses per unit at $11,251, followed by the West ($9,325), Southwest ($8,144), Southeast ($8,141), and Midwest ($7,635).
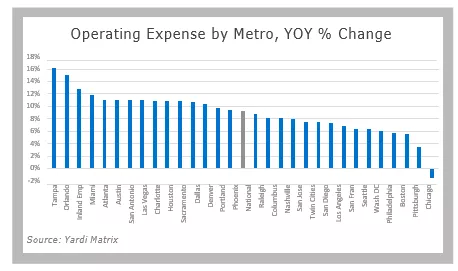
Small metros recorded the biggest jumps in expenses over the last year, led by Huntsville, Ala., where expenses increased by 20.0%. Other tertiary metros with large increases include Spokane, Wash. (18.5%); Honolulu (17.7%); South Dakota (17.3%); and South Bend, Ind. (16.6%). Large metros with the highest increases in expenses are Tampa (16.2%), Orlando (15.1%), the Inland Empire (12.8%) and Miami (11.9%). Thirteen of the top 30 metros and 54 of the 120 metros surveyed registered expense increases of 10% or more.
Seven of the 10 metros with the smallest increases in expenses are in the Northeast, including New York (-1.5%); Long Island (4.0%); Albany (4.1%); Springfield, Mass. (4.2%); and Harrisburg (4.9%). Other major metros with among the lowest increases include Chicago (3.4%), Pittsburgh (5.5%) and Boston (5.7%).
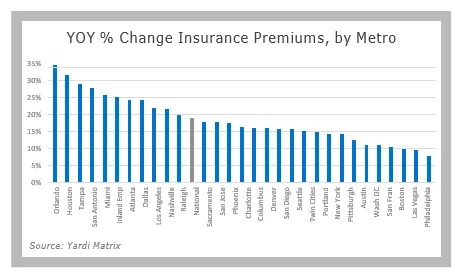
The surge in insurance costs was eye-popping, as 10 of the top 30 metros and 51 of the 120 metros surveyed registered 20% or more year-over-year increases, while 27 of the top 30 metros and 102 of the 120 metros saw insurance rates rise by 10% or more. Insurance costs are rising chiefly because of the growing number of significant weather-related events such as hurricanes, extreme temperatures, and wildfires that have created large insurer payouts, particularly in states such as Florida, California, and Texas. Many insurers and re-insurers are dropping or thinking about dropping their property casualty business.
Small metros in the Southeast were hardest hit by increases in insurance premiums, led by Huntsville, Ala. (94.5%); Mobile, Ala. (64.1%); Wilmington, N.C. (55.2%); Pensacola, Fla. (52.1%); Birmingham, Ala. (51.6%); Tallahassee 45.4%); and Jackson, Miss. (40.5%). Among major metros, the largest year-over-year increases were in Orlando (34.5%), Houston (31.6%), Tampa (28.8%), San Antonio (27.7%) and Miami (25.8%).
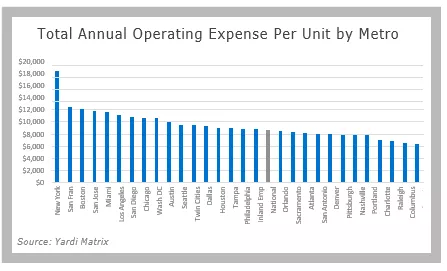
As in the regional numbers, metros with large year-over-year increases in expenses per unit tend to have lower overall expenses than large coastal metros where recent increases were smaller. For example, expenses average $9,024 per unit in Tampa, less than half of the $18,484 per unit in New York City, where expenses fell by 1.5% year-over-year through June 2023.
Not surprisingly, coastal gateway and primary markets comprise almost all of the nine top 30 metros in which per-unit expenses top $10,000. Other than New York, expenses per unit are highest in San Francisco ($12,468), Boston ($12,164), San Jose ($11,863), Miami ($11,609) and Los Angeles ($11,204). The top 10 is rounded out by San Diego; Chicago; Washington, D.C.; and Austin. Secondary markets with the highest per-unit expenses include Honolulu ($14,447); Northern New Jersey ($13,561); and White Plains, N.Y. ($12,323).
Metros with the lowest per-unit expenses are Greenville, N.C. ($4,988); Little Rock, Ark. ($4,971); and Northwest Arkansas ($4,518). Among the top 30 metros, Columbus ($6,574), Phoenix ($6,376), and Las Vegas ($6,136) have the lowest expenses.
Is Expense Growth Transitory?
Given the timing of expense growth, it may be of small comfort to property owners to note that the increase in costs is largely out of their control, caused by weather, labor demographics, supply-chain disruptions, and global economic trends. As previously noted, the timing is particularly bad, coming as rent growth is decelerating and other market conditions are worsening. U.S. asking rents rose 1.5% year-over-year as of August, the lowest growth rate since 2011, and in some markets growth has turned negative. Plus, many multifamily property owners face the prospect of increased mortgage costs as they refinance low-rate loans into a higher-rate environment. Meanwhile, the economy is widely expected to cool in the coming months as the Federal Reserve’s interest rate hikes work their way through the system.
A big question for property owners is whether increased costs are temporary or the start of a long-term trend. The answer to that may depend on the causes, whether inflation was transitory or structural. Inflation that was created or exacerbated by a transitory factor—such as supply-chain disruptions that are easing—may soon moderate. Inflation caused by long-term issues may continue to grow at above-trend levels. Labor costs, for example, could continue to increase as the U.S. faces a shortage of prime-age workers due to the aging population.
Another example of this trend might be insurance, as the number of storms that create major property damage has grown exponentially over the last decade. The National Oceanic and Atmospheric Administration said that in 2022 there were 18 weather-related incidents that caused a total of $175 billion in damage. Hurricane Idalia, which caused upwards of $5 billion of damage in its trek through the Southeast last month, provided yet the latest example.
The upshot is that with rent growth diminishing and some expense growth categories showing little sign of moderating, property owners increasingly must implement strategies to pare expense growth in order to maintain and grow net income.
Average Cost of Expense Type by Region
More By This Author:
Amid CRE Default Concerns, Bank Capital Rules To Change
2 Groups Move Toward CRE Debt Fund Standard
Commercial Real Estate Distress: How Bad Will It Get?
This document, publication and/or presentation (collectively, “document”) is protected by copyright, trademark and other intellectual property laws. Use of this document is subject to the ...
more

