
GDP Slows…Blame The Strong US Dollar
“Davidson” submits:
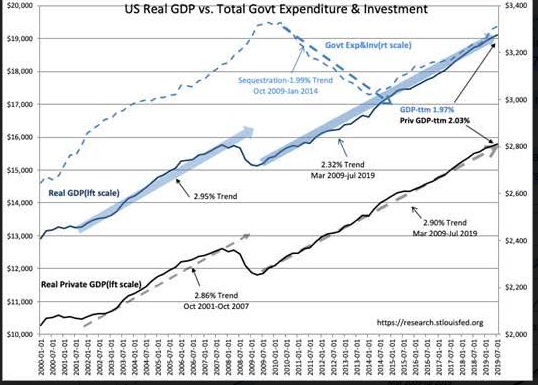
The cycle trend (Jul 2009-Jul 2019) of Real GDP has slowed to 2.32% and the ttm (trailing twelve mos) has fallen to 1.97%. The Real Private Economy (Real GDP minus Govt Exp&Inv) trend has fallen from just above 3% to 2.90% with ttm at 2.03%. The correlation of slowing GDP to periods of US$ strength is notable. US$ strength hurts US export of high-value manufactured goods including agricultural and mining/ forestry products. US$ strength in 2014-2016 due to Russia’s Ukraine invasion spurred capital shifts to US$ assets and stalled the Chemical Activity Barometer(CAB), Job Openings and Trucking Tonnage Index(TTI). The same is occurring currently. There had been a short period of US$ weakness Jan 2018-Jan 2018 which was a positive for business activity, but since the US initiated its tariff reduction policy the US$ has again strengthened as capital has fled China resulting in $17Tril of negative-rate Sovereign Debt.
Today, the Fed Reserve lowered the FFunds rate by 0.25% as expected and in recent days the yield curve spread between the T-Bill/10yr Treas has turned positive which spurs expansion of credit.
(Click on image to enlarge)
(Click on image to enlarge)
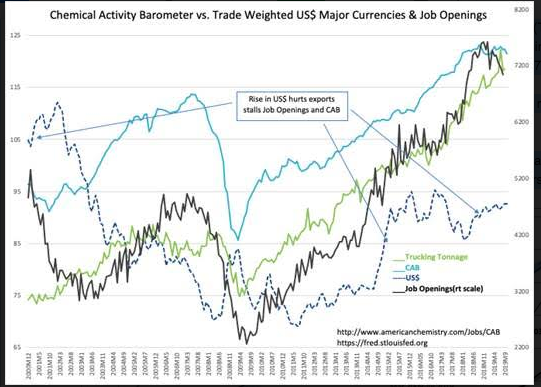
An expanding-positive rate spread is a strong positive for economic expansion and higher equity prices. Should 10yr Treasury rates continue to rise faster than T-Bill rates, the CAB, TTI and Job Opening indicators should turn higher.
Disclosure: The information in this blog post represents my own opinions and does not contain a recommendation for any particular security or investment. I or my affiliates may hold positions or ...
more
Comments
 No Thumbs up yet!

