

Executive Summary
- Interest rate policy has failed to generate an increase in the growth rate of real GDP per capita.
- After interest rates reached the zero-bound, expansionary monetary policy in the form of Quantitative Easing was tried, and the results have proven ineffective.
- After failed attempts to stimulate real GDP growth through interest rate policy and monetary policy, we are now attempting to generate lasting economic activity through fiscal policy.
- Decreases in the marginal revenue product of debt and the law of diminishing marginal returns highlight why fiscal stimulus will be the third strike for the economy.
- The economy will not see lasting economic progress through large fiscal stimulus. The rate of real growth and the inflation rate will both move lower over the multi-year view.
Fiscal Stimulus: The Economy's Third Strike
Over a generation, the economy needs nominal growth to repay debts and real growth to increase the standard of living.
Since the 1980s, the rate of economic growth per person, in both nominal and inflation-adjusted or "real" terms, has been falling sharply.
The long-term rate of growth, such as a 30-year annualized trend, is important because it highlights how the economy has performed over a generation.
Since the economy started to show a declining rate of growth in the 1990s, policymakers have tried to lower interest rates, experimental monetary policy and are now embarking on what will ultimately be the third strike for the economy; fiscal stimulus.
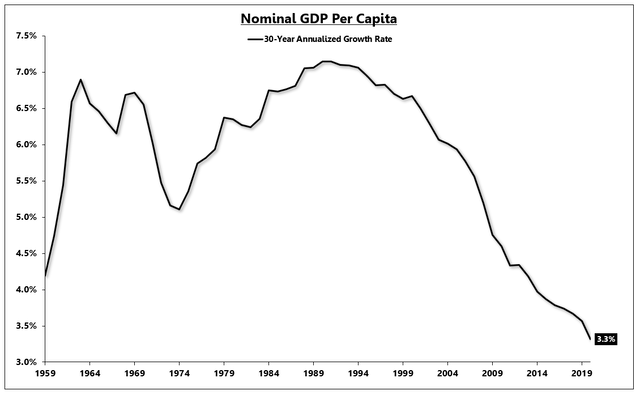
Despite lowering interest rates from double digits to zero percent, the long-term rate of nominal growth only moved lower.
In 1990, the economy closed a 30-year period of 7% nominal growth per person. In the 30-year period ending in 2020, the economy only grew 3.3% per person in nominal terms.
Nominal GDP Per Capita: 30-Year Annualized Growth
Source: FRED, BEA | To Expand, Right-Click > "Open Link In New Tab"
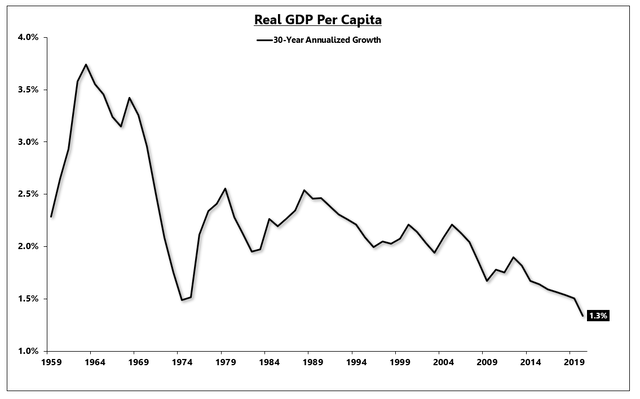
In real terms, the economy grew at 2.5% for the 30 year period ending in 1990 compared to just 1.3% in the 30-year period ending in 2020.
Despite lowering interest rates and expanding the monetary base, economic growth in both nominal and real terms showed no improvement.
Real GDP Per Capita: 30-Year Annualized Growth
Source: FRED, BEA | To Expand, Right-Click > "Open Link In New Tab"
Since 1990, the standard of living has only increased at a rate of 1.3% for the average person. Given the extreme wealth gap in the United States, it is clear that a large percentage of the population actually saw their standard of living decline over the last 30 years.
Interest rate policy has reached its logical conclusion at the zero-bound, with central banks unwilling to use deeply negative interest rates, and the rate of growth generated per dollar of monetary base expansion has collapsed by roughly 80%.
With the inability to stimulate economic advancement through interest rate policy or experimental monetary policy, extreme fiscal stimulus is the third attempt to change the trajectory of the economy.
The results will prove just as ineffective and ultimately the third and final strike.
In the short term, over the next couple of quarters, the economy still has cyclical momentum covered in the last monthly Cyclical Indicators report. Over the 3-5 year view, unproductive fiscal policy will not generate lasting economic growth in either nominal or real terms.
Interest Rate Policy
The first attempt to spur economic growth came in the form of interest rate policy; the first tool most policymakers use to stimulate aggregate demand.
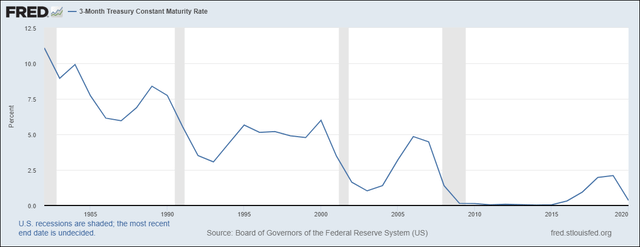
Charted below, the 3-month Treasury rate has declined from over 10% in the 1980s to a rate of 0% in 2009.
The short-term policy rate climbed to nearly 2.5% in the last cyclical upturn of 2016-2018, but the rate started to come back down towards 0% prior to the COVID recession.
3-Month Treasury Rate:
Source: FRED | To Expand, Right-Click > "Open Link In New Tab"
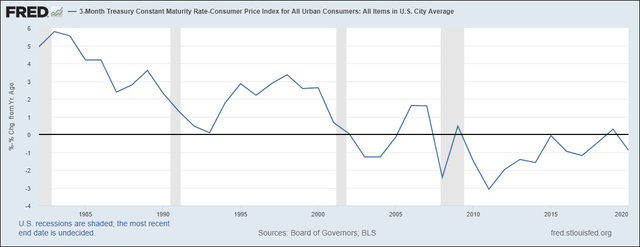
In inflation-adjusted or "real" terms (3-month Treasury rate minus inflation), short-term interest rates have been negative for nearly the entire last 10 years and for a majority of the last 20 years.
Negative real interest rates, as low as -3%, created no material difference in the trend of economic growth.
"Real" 3-Month Treasury Rate:
Source: FRED | To Expand, Right-Click > "Open Link In New Tab"
With short-term interest rates pegged near 0%, the real interest rate will only move as low as the inflation rate dictates.
Even if inflation averages 3% for 2021, which would be a high estimate, the real interest rate will decline to roughly -3%, which proved to have no material effect on the long-term rate of economic growth.
As interest rate policy proved ineffective, policymakers tried to expand the monetary base through quantitative easing "QE."
Monetary Policy
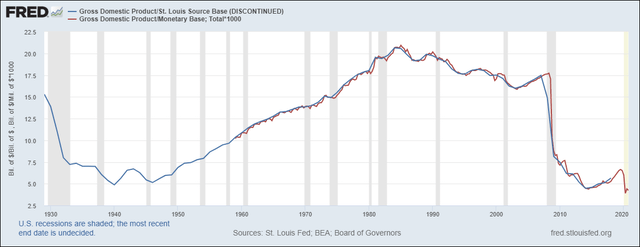
Charted below is the ratio of GDP to the monetary base or, in other words, how much growth are we generating per dollar of the monetary base.
The monetary base is controlled completely by the Federal Reserve and consists mainly of currency in circulation and reserve balances held at the Fed.
From the 1940s through the 1980s, the amount of growth generated per dollar of monetary base increased from roughly 5 to 20.
From roughly 1980 through the mid-2000s, before QE was introduced, the amount of growth generated per dollar of monetary base fell from 20 to 17.5.
GDP Generated Per $1 of Monetary Base:
Source: FRED | To Expand, Right-Click > "Open Link In New Tab"
In 2009, the Federal Reserve changed the operating framework and shifted to an "ample reserve" regime, which collapsed the amount of GDP generated per dollar of the monetary base.
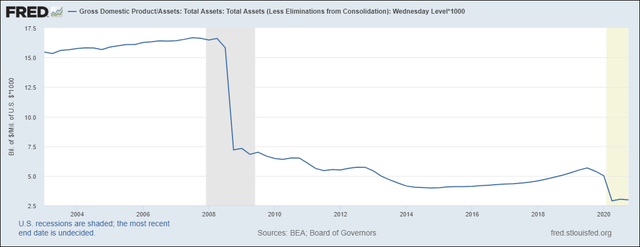
Looked at in another way, the amount of GDP growth generated per dollar of the Federal Reserve balance sheet continues to decline. The ratio declined after the COVID lockdown and did not rebound even though the economy staged a 30%+ quarterly bounce at the end of the year.
GDP Generated Per $1 of Federal Reserve Balance Sheet:
Source: FRED | To Expand, Right-Click > "Open Link In New Tab"
Monetary policy has reached its end game as the Federal Reserve can only generate ~$2.5 of growth per dollar increase in the balance sheet.
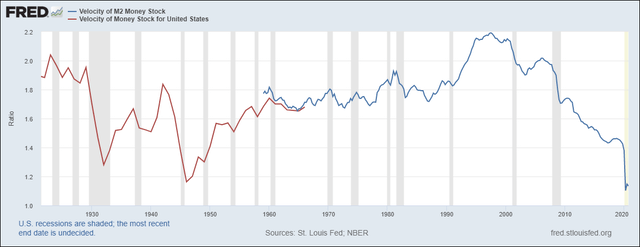
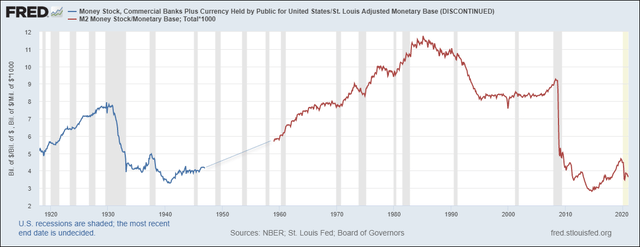
The amount of GDP generated per dollar of the money supply, also known as velocity, continues to crash, falling to the lowest level in over 100 years.
(Velocity) GDP Generated Per $1 of Money Supply:
Source: FRED | To Expand, Right-Click > "Open Link In New Tab"
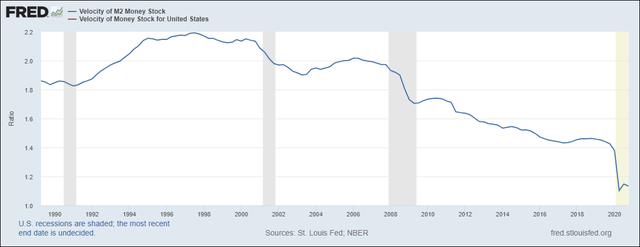
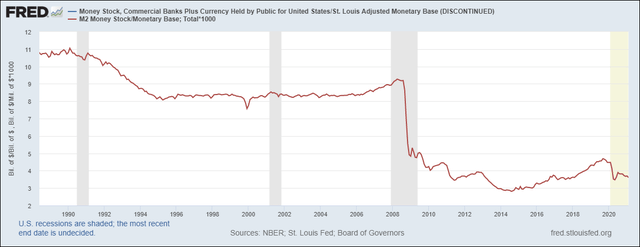
It should be abundantly clear that increasing the monetary base, the Federal Reserve balance sheet, or the money supply are not generating an increase in the economic growth rate, and the efficacy of these policies has crashed to levels that make further increases in the monetary base or money supply futile.
(Velocity) GDP Generated Per $1 of Money Supply:
Source: FRED | To Expand, Right-Click > "Open Link In New Tab"
The Federal Reserve controls the monetary base, but they do not completely control the money supply (M2). M2 is influenced by the Federal Reserve but is ultimately controlled by the banking system and the economy as a whole.
Charted below is the money multiplier or the amount of M2 generated per dollar of the monetary base.
(Money Multiplier) Money Supply Generated Per $1 of Monetary Base:
Source: FRED | To Expand, Right-Click > "Open Link In New Tab"
The money multiplier has continued to decline even as the economy reopened in Q3 and Q4.
The money multiplier and the amount of GDP generated per dollar of the monetary base do not have to decline. There have been 20-year periods in which these ratios increased. The continuous decline speaks to the decline in demographics and the weakening of productivity coming from increased debt burdens.
The economy is not creating new money through productive loan growth or the fractional reserve banking system but rather through direct monetary injections from the Federal Government (not Federal Reserve).
(Money Multiplier) Money Supply Generated Per $1 of Monetary Base:
Source: FRED | To Expand, Right-Click > "Open Link In New Tab"
The Federal Reserve has two main policy tools under the current legal structure. The Fed can change short-term interest rates and expand the monetary base.
With interest rates at 0% and the efficacy of increases in the monetary base collapsing over time, the only policy choice left is fiscal policy which is why Jerome Powell and the Federal Reserve have been extremely vocal about the need for large fiscal policy.
Essentially, the Federal Reserve is saying that we have no tools left to stimulate growth.
Fiscal Policy
We have now entered the stage of the game where fiscal policy is the new tool. Ironically, fiscal stimulus is far from new and has been tried relentlessly since the 1980s, but now we are assuming that "shock and awe" type numbers will fix the 30-year trend of weakening nominal and real economic progress.
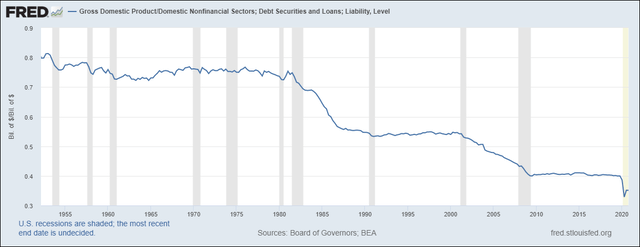
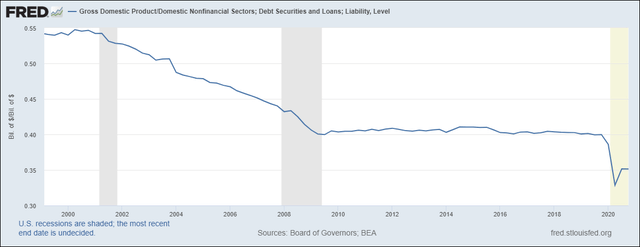
Charted below is the amount of GDP growth generated per dollar of nonfinancial debt. This is called the marginal revenue product of debt or MRPD.
Nonfinancial debt includes government debt, household debt, and business debt. Moving forward, debt will refer to the collective domestic nonfinancial debt.
In the 1950s and through the mid-1980s, the economy generated in between 70 cents and 80 cents of growth per dollar of debt.
This is why large increases in debt were effective, such as the Reagan tax cut, the MRPD was very high.
GDP Generated Per $1 of Nonfinancial Debt:
Source: FRED | To Expand, Right-Click > "Open Link In New Tab"
If debt is used to fund a use that generates an income stream to repay the debt, the MRPD will rise or stay flat.
If debt is used to fund a use that does not generate a lasting income stream, then money has to be diverted from future income to repay the debt, or we have to borrow more money to repay the old money which will lower the MRPD.
Since the 1950s, the MRPD has fallen from 80 cents to 35 cents, yet today we are embarking on massive *unproductive* fiscal stimulus, thinking that this is the path to sustained economic progress.
The MRPD does not have to decline; it depends on how the money is spent.
From roughly 1955 through 1975, the MRPD was flat at 76 cents.
GDP Generated Per $1 of Nonfinancial Debt:
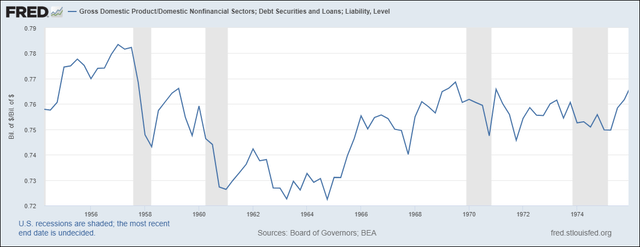
Source: FRED | To Expand, Right-Click > "Open Link In New Tab"
Over the past 20 years, the MRPD or the efficacy of debt-based stimulus has crashed as the majority of spending programs have not been "productive" based on the criteria outlined above.
GDP Generated Per $1 of Nonfinancial Debt:
Source: FRED | To Expand, Right-Click > "Open Link In New Tab"
It is difficult to discuss government policy without wandering into the realm of politics, but it would be incomplete to discuss the issue of declining MRPD without covering massive secular changes in the way the government spends money.
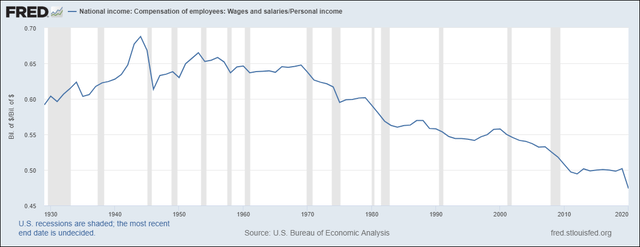
In the 1940s, wages comprised almost 70% of total income. Today, wages or earned income represent less than 50% of the total income in the country.
Wages As A % of Total Income:
Source: FRED | To Expand, Right-Click > "Open Link In New Tab"
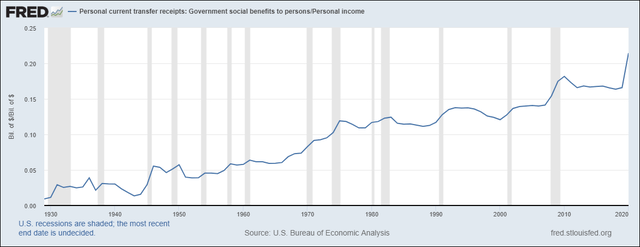
Transfer payments, generally funded with debt, have increased from less than 5% of total income in the 1940s to over 20% at the end of 2020.
Transfer Payments As A % of Total Income:
Source: FRED | To Expand, Right-Click > "Open Link In New Tab"
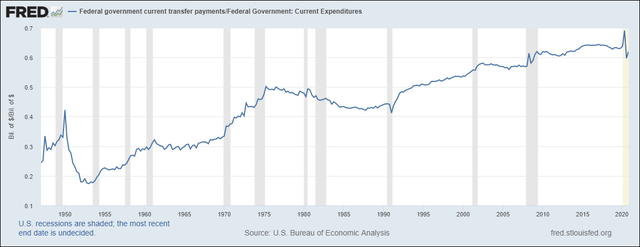
In the 1950s, less than 20% of total government spending was for transfer payments. Today, over 60% of government spending is for transfer payments.
It should not be a surprise that the MRPD is declining as taking on debt to send people money isn't guaranteed to generate growth. People can save the money or use it in other ways (stocks) that don't contribute to increasing GDP in either nominal or real terms.
Government Transfer Payments As A % of Total Current Expenditures:
Source: FRED | To Expand, Right-Click > "Open Link In New Tab"
If we map the 10-year annualized change in the MRPD, we can see that the efficacy of debt spending has been in perpetual decline since the 1970s.
MRPD: 10-Year Annualized Change (%)
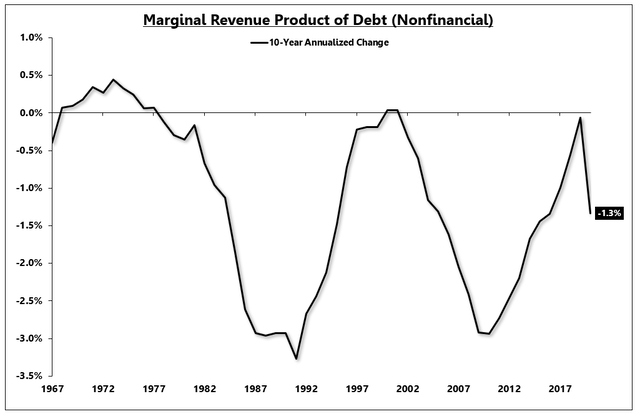
Source: FRED, EPB Macro Research | To Expand, Right-Click > "Open Link In New Tab"
On a 20-year basis, the MRPD has declined at roughly 2.1% per year.
In other words, with a lower MRPD, it will take more spending to generate the same amount of growth.
MRPD: 20-Year Annualized Change (%)
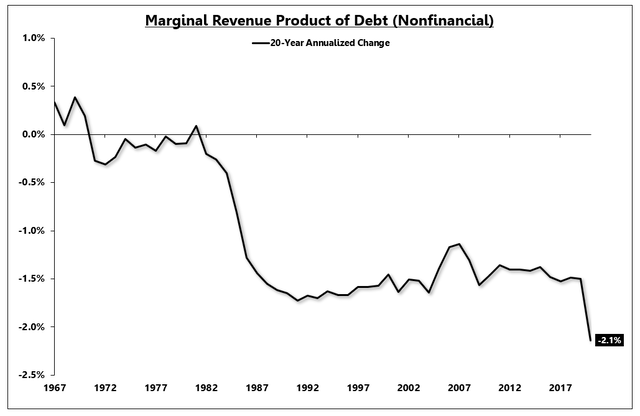
Source: FRED, EPB Macro Research | To Expand, Right-Click > "Open Link In New Tab"
Debt spending was occurring well before COVID, the lastest recession just amplified the dollar amounts, and we now believe that bigger numbers will work better than smaller numbers.
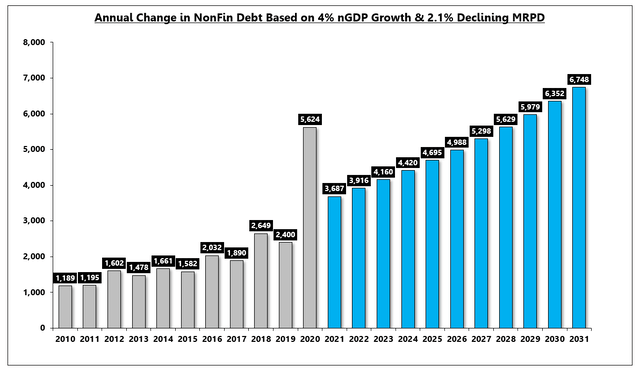
In the 10 years leading up to COVID, nonfinancial debt rose in between $1T and $2.7T per year, increasing in the later years, hardly austere debt policy.
Nonfinancial debt increased almost $6T in 2020, and the new idea is that we will spend roughly $5T per year in perpetuity.
Set aside the fact that many of these spending packages have disbursements that last multiple years.
Annual Change In Nonfinancial Debt (Billions)
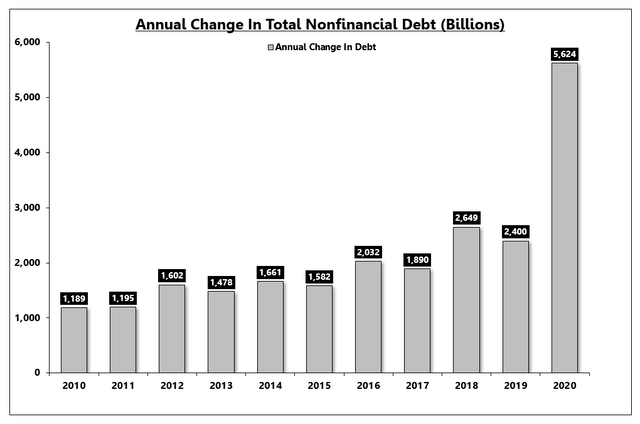
Source: FRED, EPB Macro Research | To Expand, Right-Click > "Open Link In New Tab"
We can estimate how effective the debt growth will be if we assume some continued decline in the MRPD.
Given that the MRPD has not increased for a 10-year period since the 1970s and the current spending is geared heavily towards transfer payments, we can assume a continued decline in debt efficacy.
The last 20-years have shown a 2.1% annual decline in the MRPD, but if we use a conservative 1.5% annual decline, we can see the impact on nominal GDP growth.
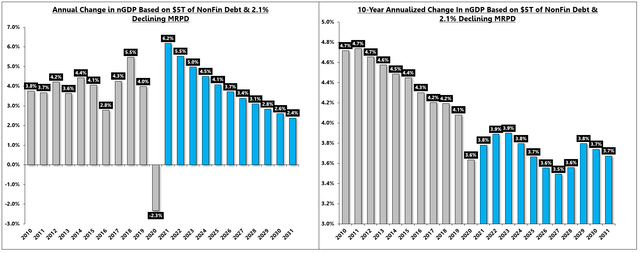
The chart below shows (left) the yearly growth rate in nominal GDP, assuming $5T in nonfinancial debt per year and a 1.5% annual decline in the MRPD.
It is a tall order and perhaps hyperbolic to assume $5T in debt spending per year, but even if that case came true and the efficacy of the debt continued faltering, by 2024, we would have an annual growth of 5.1%, less than the 2019 growth rate. The 10-year annualized growth rate would not move materially above the 4% trend despite this massive debt spending.
Change In Nominal GDP Growth Based On $5T in Annual Debt & -1.5% MRPD
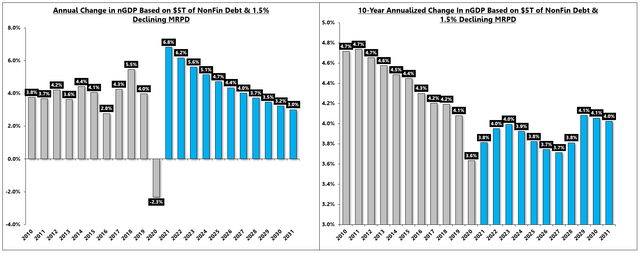
Source: FRED, EPB Macro Research | To Expand, Right-Click > "Open Link In New Tab"
So using this bold debt-based spending strategy, at the end of the decade, we would have 3% nominal GDP growth and a debt to GDP ratio that increased from 250% before COVID to over 330% by 2030.
So, what did we gain through this policy?
Debt To GDP Based On $5T in Annual Debt & -1.5% MRPD
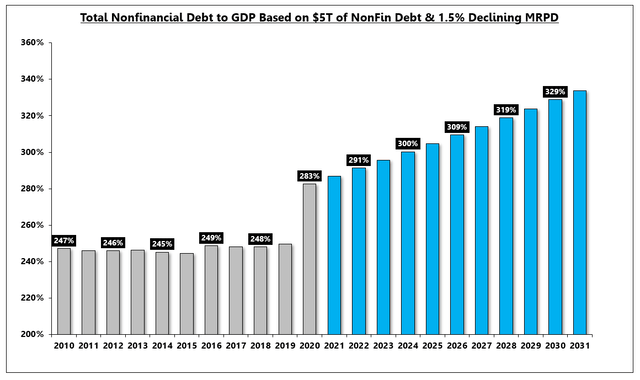
Source: FRED, EPB Macro Research | To Expand, Right-Click > "Open Link In New Tab"
If we assume that the MRPD will decline at the 2.1% annual rate that we've seen over the last 20 years, nominal growth will drop below the 2019 level by 2023, will end the decade at 2.6%, and will generate a 10-year trend below 4%.
Change In Nominal GDP Growth Based On $5T in Annual Debt & -2.1% MRPD
Source: FRED, EPB Macro Research | To Expand, Right-Click > "Open Link In New Tab"
Debt to GDP will increase 100% in a decade, in this case to over 350%.
Debt To GDP Based On $5T in Annual Debt & -2.1% MRPD
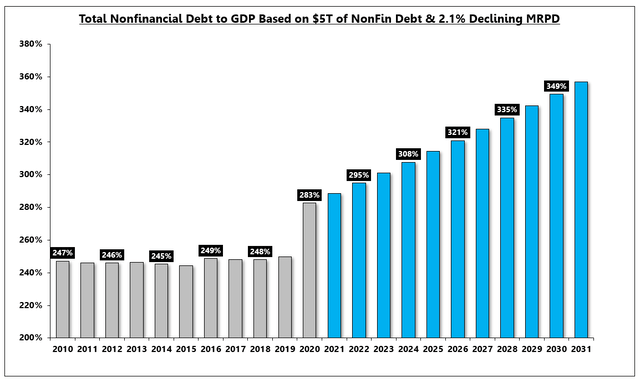
Source: FRED, EPB Macro Research | To Expand, Right-Click > "Open Link In New Tab"
What if we assume that we would do whatever it takes in terms of debt spending to generate a consistent 4% nominal GDP growth rate?
If the MRPD continues to decline at a 2.1% annual rate, by the end of the decade, we would need over $6T in annual spending from the domestic nonfinancial sector to generate the same 4% GDP growth that took only $1T in the early 2010s.
Annual Debt Needed To Sustain 4% nGDP Growth Based On -2.1% MRPD
Source: FRED | To Expand, Right-Click > "Open Link In New Tab"
By engaging in large and consistent fiscal spending, we are making a bet that the MRPD will not continue declining. Otherwise, the MRPD will outpace the spending, and the nominal GDP growth rate will still fall.
In 2016, the global economy was in a slump, and there was talk of coordinated global fiscal policy.
The team at the Economic Cycle Research Institute "ECRI" wrote a research paper discussing the impacts of fiscal spending on long-term growth.
The excerpt below discusses why fiscal spending generally does not change the long-term trend rate of growth and what happened during World War II that was unique.
Cyclical Misconceptions: ECRI Paper
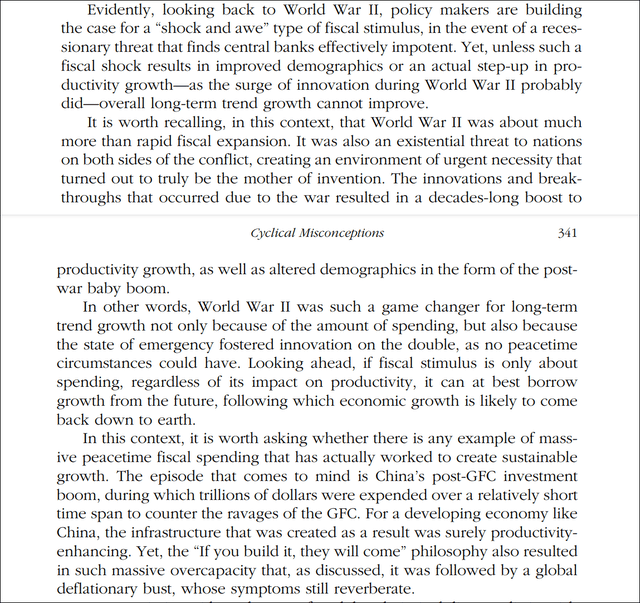
Source: ECRI
In short, if the spending does not generate a boom in productivity or change future demographics, the results will not prove materially different than the past, despite the larger face-value numbers.
You can look at the charts from the latest research note on Initial Conditions to see the demographic differences between the 1940s and today.
Summary
Long-term growth will be a function of productivity and demographics. Productivity can be proxied through the MRPD.
The United States still has the greatest MRPD compared to the UK, Europe, and Japan.
MRPD By Major Country:
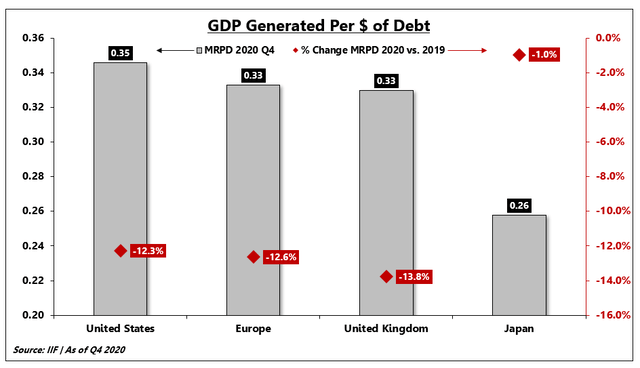
Source: IIF | To Expand, Right-Click > "Open Link In New Tab"
Fiscal stimulus will clearly not change future demographic trends, which are worse in all major countries (best in the US), charted below.
Population Growth:
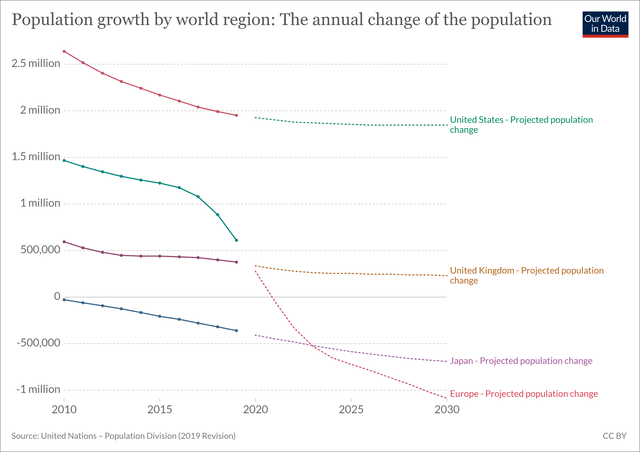
Source: United Nations, Our World In Data | To Expand, Right-Click > "Open Link In New Tab"
If the fiscal stimulus does not change productivity or the MRPD, but actually makes it worse, then nominal GDP growth and real GDP growth will move lower in the future, not higher, and fiscal stimulus will prove to be the economy's third strike.
Large fiscal stimulus can surely cause above-trend growth for a period of time, and interest rates and other assets would likely respond to this short-term boost, but taking the 3-5 year view argues for weaker growth ahead after the effects of the reopening, and first few spending packages fades.
It remains critical to differentiate between cyclical trends and secular trends.
More By This Author:
Is Your Portfolio Suffering From The Coronavirus Outbreak?Despite "Valuation Hawks", Utilities Continue To Be The Market Leader
The Treasury Rally Is Set To Continue - Here's Why


Comments
Log in or sign up to join the conversation.